In version 23, we added this feature to the crosstab. Now, finally in 24 we’ll extend this feature to work with groups as well.
The result is similar to the effect you’ll get when selecting to suppress the data lines while forcing sum calculations. That’s a quite popular feature for simple statistic reports. However, with the new feature, you can then expand the group right from the preview window to drill down to further details. Let’s do a simple walkthrough:
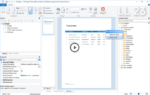
Starting with our standard sample “Item report with grouping” for our famous sample application:

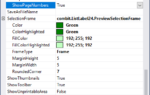
Double clicking the group header for the main group takes you to the table contents dialog. Select the header line and find the all new “Expandable Region” property:

Now the preview will show all groups collapsed – of course we could fine tune the layout as well or even show the group sum in the group header e.g. by using Precalc() or even faster a native aggregate function.

And a click on the expander allows you to expand just one of the groups to drill into the details:

Your application will need to support the usual real data preview and drilldown events for this feature to work, as List & Label needs to be able to trigger a refresh for the preview. Of course, our .NET and Delphi components handle this automatically in the background.

Leading the development at combit as Managing Director. Microsoft .NET enthusiast driving innovation & agile project management. Used to be a physicist in my first life. I love hiking and vanlife.