Swagger and OpenAPI Support for Report Server REST API
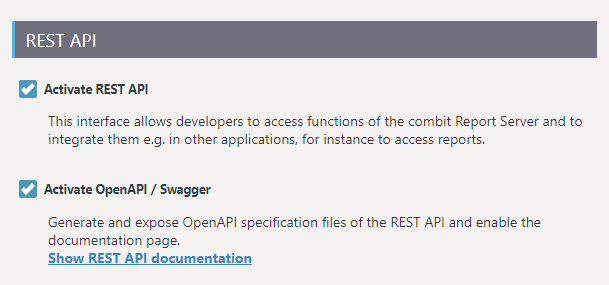
The OpenAPI Specification (OAS) defines a standard interface description for REST APIs, which allows both humans and computers to discover and understand the capabilities of a service without requiring access to source code, additional documentation, or inspection of network traffic.