Autosize for Column Widths

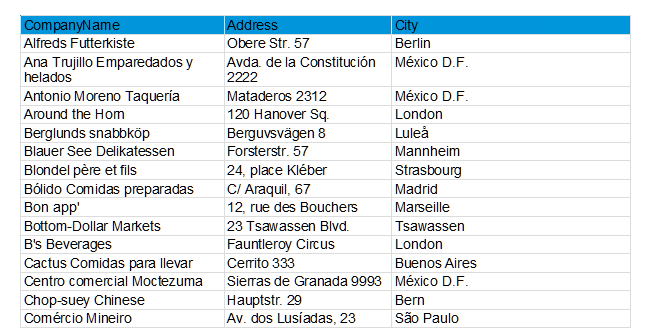
Another step forward in our continuing quest to improve what's already great – our table object. Until LL25, you had to decide which widths you'd like to reserve for your respective columns. While this works out just nice most of the time, sometimes the result is less than perfect.

Defining Sub Tables via Filter Conditions

This is another great addition to the report container's feature set. Until LL25, related tables always needed to have an actual relation on the data source level in order to be usable as data source for sub items. If there was no relation, there was no way to insert the sub item, even if both tables in question had an ID field that would easily allow a custom linkage. In LL25, you can now have relations based on filter conditions.

Printing Columns Across-Down

Multi-columnar layouts for tables are quite popular for newspaper or phone book style reports. Whenever you have just a few actual columns in the table it's handy to use the page's real estate by splitting it in multiple columns. This feature has been around for ages, however it was missing one important setting until LL25.

Create Functional Dashboards in Seven Easy Steps

Complex data is usually processed visually in dashboards in order to be able to capture trends, outliers or up-to-date data at a glance. The design of dashboards depends on important details. These details make the difference between whether the information is interesting for the target group and whether conclusions can be drawn from it or not. For example, a bar chart is better to capture than to work your way through hundreds of table entries. Dashboards are often used incorrectly and are hopelessly overloaded with numerous different charts and gauges, such as traffic lights, speedometers and hardly readable tables.

How to Automatically Export Reports to Cloud Storage Services

With List & Label you can export reports in different formats like PDF, Word, Excel and many more. The resulting reports can either be stored directly in the file system or – in .NET – in a stream, in order to transfer them manually into a database, a document management system or similar. Reports can also be automatically stored directly in so-called cloud storage services. The cloud storage providers for GoogleDrive, Microsoft OneDrive or Dropbox are available in List & Label for .NET for this purpose.

New Connection to Microsoft Flow for the Report Server

Microsoft Flow allows you to define your own processes and workflows based on various triggers. More than 200 services such as Office 365, Facebook, WordPress etc. are available for this purpose, which can interact with each other in the workflows (called flows). These services offer actions as well as triggers, such as when a file is created (on Google Drive, DropBox or also on alternative services like e.g. box) or when a mail is received. Each flow has a trigger and may have multiple actions. This article describes how to connect combit Report Server to Microsoft Flow.

New DataProvider for Redis

Redis is an in-memory key-value database, so a typical NoSQL database. Since its initial release in 2009, it has become quite popular and now is, according to db-engines.com by far the most popular key-value database out there. With the new RedisDataProvider you can now use your Redis database within List & Label or Report Server.