Enhanced Color Picker
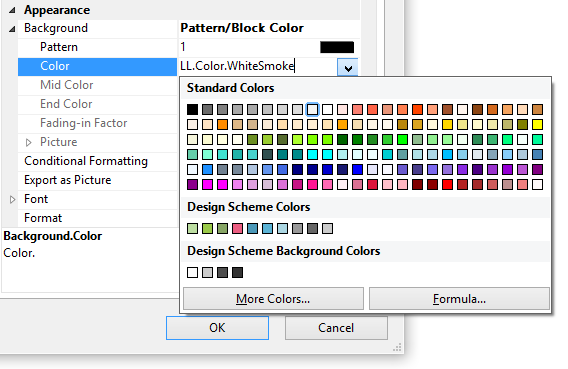
The existing color picker e.g. for the background color property of a field contained a very long list of predefined color values and – at the very bottom – a "Formula…" entry, which was neither very discoverable nor usable. And choosing "Formula…" left it completely to your end users to figure our how to use the RGB, HSL, RainbowColor, HeatmapColor or one of the other color functions. In LL21, we'll introduce a completely new color picker UI.