Pivot/crosstabs now available in the Web Report Designer

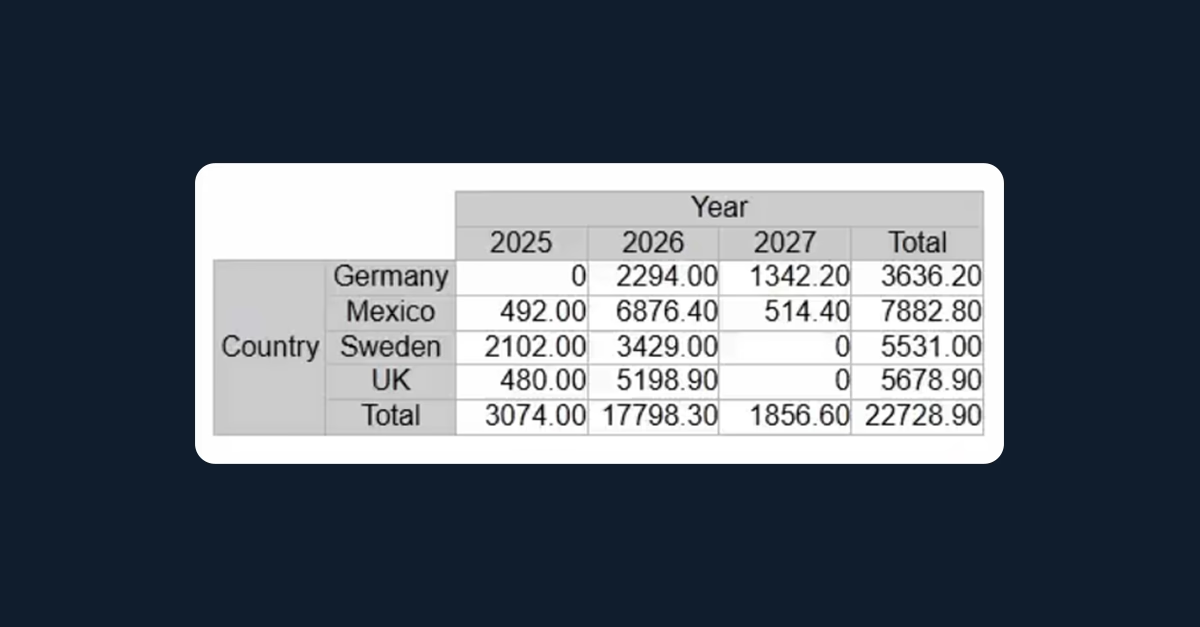
Create Crosstabs in the List & Label Web Report Designer

Crosstabs have long been one of the most powerful analysis features in List & Label. They allow data to be aggregated across multiple dimensions by combining row and column groupings with calculated values. Whether you’re comparing sales by quarter and region, analyzing orders by product category, or summarizing business metrics across different dimensions, crosstabs provide an efficient way to uncover trends and patterns.


Stop outgrowing your .NET reporting: How to avoid “We have to rewrite this”

chat between devs about rewriting reports

Most .NET teams don’t set out to build a reporting subsystem that needs rescuing. But “just generate a few PDFs” can quietly become a tangle of layout logic, export workarounds, and growing technical debt—until someone says, “We have to replace this.” Here’s how to spot that pattern early, and how to avoid backing your application into a reporting rewrite later.