New Features for the Web Report Designer in List & Label 27.002

notebook with web report designer

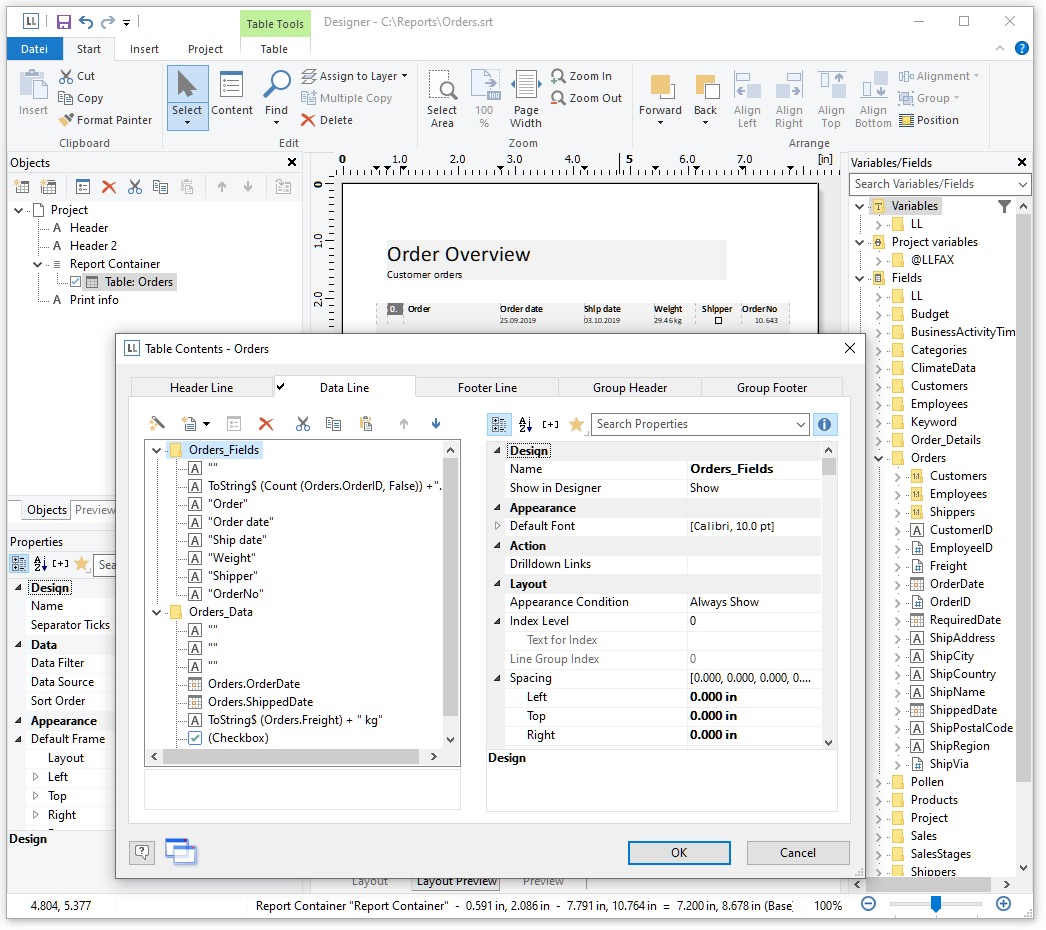
The Web Report Designer is an essential tool for using List & Label within web applications. We’re striving for constant improvements and enhancements – the plan is to add new features with each service pack we publish, until we’ll reach feature parity with the well-established Desktop Designer. Here’s a first glance what we were working on since the release.

Finally – a Glance in the Crystal Ball

An often required feature for "this cannot be done" type of problems is looking into the future. Things like "don't print this group if it doesn't contain record xy" or "print a reference to the page number of an item that's printed way later". Before List & Label 26, there was no simple solution to this and the magic had to be done in the application if possible at all. Starting with List & Label 26, we'll introduce a new feature that's aimed at solving exactly challenges like this.

Powerful, Reusable Subreports for Your Reports

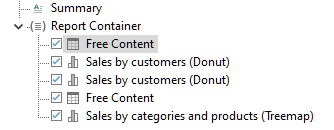
Often reports consist of similar, repetitive sections like a number of charts or crosstabs just filtered for different categories but otherwise identical. Or tables and subtables that have a preselected set of columns you want to have wherever this table is used. List & Label 26 now helps you and your users to get rid of the tedious task to maintain such reports and apply changes to all instances of objects. You can add real subreports that contain exactly the required items and maintain those in one single place.

Printing Columns Across-Down

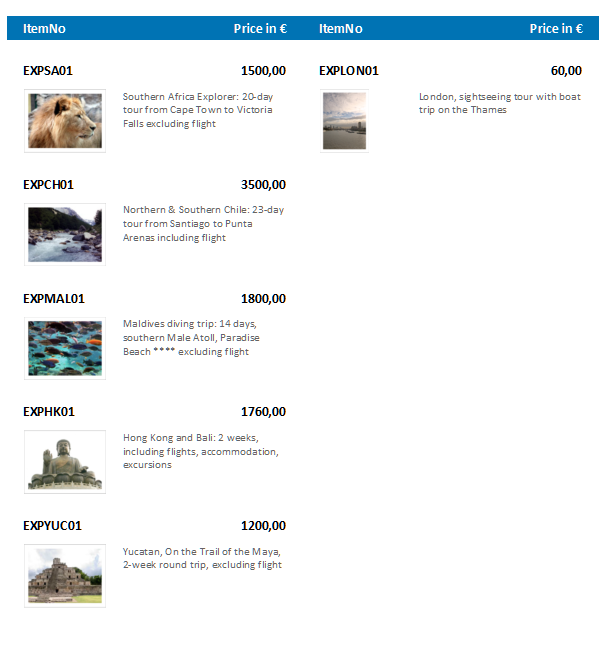
Multi-columnar layouts for tables are quite popular for newspaper or phone book style reports. Whenever you have just a few actual columns in the table it's handy to use the page's real estate by splitting it in multiple columns. This feature has been around for ages, however it was missing one important setting until LL25.

Creating Pivot/Crosstabs via Drag & Drop

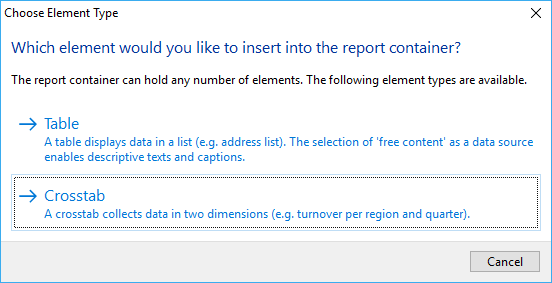
dialogue choose table element type

A pivot/crosstab does a great job in aggregating your data and helps to spot trends and outliers. We’ve put great effort in enhancing our pivot/crosstab support for the last few versions. However, although there’s a nice wizard to get you started, usability testing showed that even creating simple pivot/crosstabs was still a challenging task for some users. That’s something we hope to change with LL24.

Supporting Cross-Datasource Relations

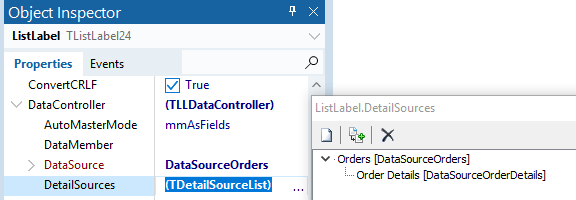
The .NET DataProvider concept allows to bind to almost any data source. Basically, it mimics a relational database management system containing tables, relations, sort orders etc. However, often you’ll find yourself needing to combine data from different sources, e.g. a server log file that contains customer logins and a SQL customer database that contains all pertinent information about the customers.