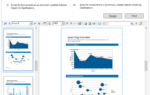
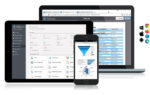
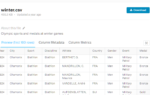
With List & Label 31.002, this functionality is now available directly in the Web Report Designer (WRD). Until now, crosstabs could only be created and edited using the desktop designer. The latest Service Pack brings full crosstab support to the browser, making it possible to build and modify these reports entirely online. Crosstab support is one of the key enhancements introduced for the Web Report Designer in version 31.002.
Stay in the browser
For many development teams, this removes one of the last reasons to switch back to the desktop designer.
If your application exposes reporting exclusively through the Web Report Designer, advanced analytical reports previously required a desktop-based workflow. With version 31.002, that extra step is no longer necessary. Users can now create, configure, and maintain crosstabs directly in their browser.
No additional installations. No switching tools. Just a seamless reporting experience from start to finish.
A familiar workflow
Creating a crosstab in the Web Report Designer follows the same concepts List & Label users already know:
- Define row groupings
- Add column groupings
- Configure result cells using aggregate functions such as Sum, Average, or Count
- Instantly verify the result using the live preview
All configuration is performed directly from the properties panel, allowing report authors to stay within a single, consistent design environment.
Typical use cases
Crosstabs are particularly useful for analytical reporting scenarios such as:
- Sales by year and quarter
- Revenue by customer and region
- Orders by product category
- Multi-dimensional business reports with multiple grouping levels and aggregated metrics
By combining row and column groupings with calculated result cells, crosstabs provide compact summaries that make trends, comparisons, and outliers much easier to identify. List & Label supports multiple grouping levels as well as a variety of aggregation functions to build sophisticated analytical reports.
Another milestone for the Web Report Designer
With crosstab support, the Web Report Designer closes another important functional gap to the desktop designer.
For developers, this means that even more reporting scenarios can now be implemented entirely in the browser. End users benefit from a consistent reporting experience—from creating straightforward tabular reports to designing sophisticated multi-dimensional analyses—without ever leaving the web application.
As more reporting functionality moves to the browser, deploying and maintaining web-based reporting solutions becomes even simpler while offering users the full analytical capabilities they expect from List & Label.

Working in Marketing for List & Label, creating Videos, Blogposts and Social Posts.