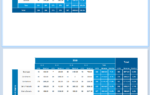
Let’s do a quick walkthrough. We start with one of the “classy” examples, a crosstab showing the number of sold items per Shipper, Category, Quarter and Year:

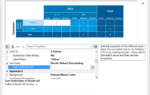
By the way, the dark blue total column displays the same amount as the year-total 2015 because we only use data from 2015 in this crosstab. Now we’d like to add a result cell for the generated revenue. Using the new feature is straight forward – where there was a simple edit field in version 21 we now have a list of entries for the result cells. In this shot, we already added the new revenue result cell on the bottom right hand side.

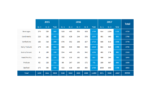
The new aggregates are printed side-by-side in the crosstab, i.e. the crosstab grows in size horizontally:

If you like, you can assign a separate column heading to each of the new cells by setting the new “Row Header” property of the cells:

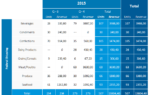
Of course, the overall results also reflect the new columns, so you not only get the aggregations for details but also for the totals per year/quarter etc. The new feature greatly enhances the crosstab’s usability. You have been able to kind of get this feature before by using the “Displayed Content” property in creative ways. However, this was error prone and cumbersome to fiddle with. The new solution makes multiple result cells a first class Designer citizen.

Leading the development at combit as Managing Director. Microsoft .NET enthusiast driving innovation & agile project management. Used to be a physicist in my first life. I love hiking and vanlife.