Converting Crosstabs to Charts and Vice Versa With List & Label
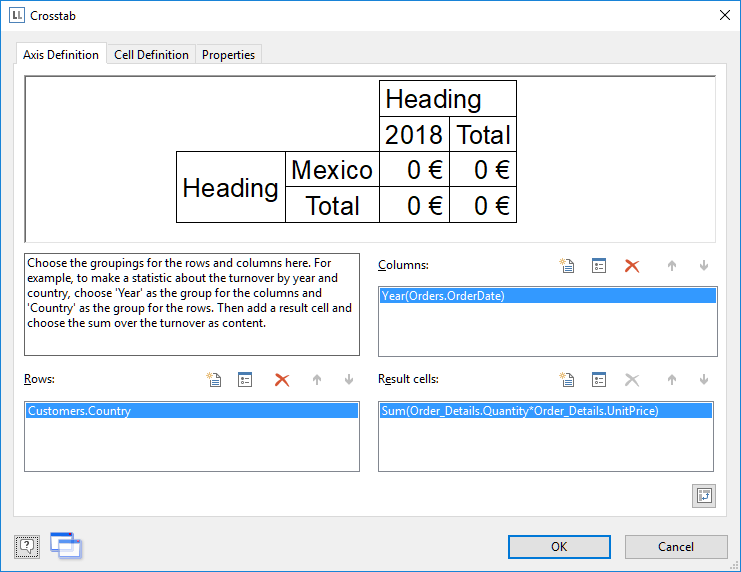
Crosstabs and charts have a lot in common. Often I find myself designing a crosstab for e.g. the sales per country. This works fine to get the absolute or even relative numbers. However, to get a visual impression of the fractions for a dashboard, I add a chart 99% of the time that shows just the same data as the crosstab.