In principle, the core DLLs now get direct access to the .NET DataProvider interfaces we’ve been featuring for quite a while now. This implies that you can use the new mode only if you’ve switched over to using a DataProvider as data source. This is the reason why we’ve obsoleted the “old” compatibility options in service pack 19.002. Your custom DataProvider implementations will work right out of the box with this new feature.
For non-.NET languages, support for this feature will be very tricky. You need to work with COM interfaces and rewrite a DataProvider implementation for your specific language. While we won’t be documenting this process we’ll be happy to help anyone interested in implementing this. The good news is that the new mode blends in seamlessly. If you don’t support it, you can just leave your application as it is and still have access to the report container – albeit, just one instance of it.
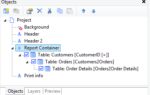
In the new mode, you can insert as many report containers or stand-alone charts, crosstabs or Gantts as you like. This makes printing complex ad hoc dashboards a breeze – just add your charts exactly where you want them to be, no more fiddling with multi-column report containers, column breaks and layout changes. This feature also enables side-by-side reports where two columns with completely different information flow side by side – something that just wasn’t possible before. In invoices, you can add a table with received payments in the header or footer area. All in all, this feature marks the biggest advance in layout possibilities since the initial report container feature in version 11. The following screenshot shows a (not yet polished ;-)) sample for this feature I’ve just mocked up.

Note the multiple charts and report containers in the objects window – you might recall the previous feature focus in which I described how we combined this with the now obsolete report structure window.
We’re very interested in hearing about compatibility during our beta test period due this September. Great attention was paid to make sure that all of our test reports that we use to validate any new build are running in the new mode and yield the same results as in the old mode. For any very tricky cases which we’re not aware of yet, the new mode can also be switched off completely, resulting in List & Label 20 behaving just like version 19

Leading the development at combit as Managing Director. Microsoft .NET enthusiast driving innovation & agile project management. Used to be a physicist in my first life. I love hiking and vanlife.