Since this concern kept popping up though, naturally on our side the question came up whether there was a different answer to it. The basic problem always was that, with a sufficiently complex structure, the field names window would have to hold a gigantic amount of data, if it were to display all the relationships. We’ve already solved this problem in an earlier version. With the help of the same technology, we were finally able to completely resolve it in version 29. Now, when using the standard data binding mode with data provider, the desighner also offers 1:n relations, for example for drag & drop.
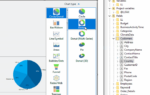
The feature is rather humble. The Northwind database once again serves as an example. We have a 1:n relationship between “Customers” and “Orders”. This is now shown in the designer:

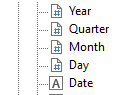
Fields from different hierarchy levels can be selected for drag & drop operations. To do so, just keep pressing the Ctrl key. The order of selection also determines the field order in the resulting table.

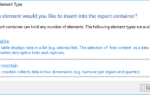
The drop operation creates the required hierarchy in the object window:

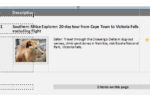
The fields are distributed across the tables, depending on the hierarchy level. As a result, a finished 1:n report is created with a drag & drop operation:

The same applies for cross tables and charts, using drag & drop takes the selected hierarchy directly into account. A huge thanks to everyone who asked us the same question over and over again – we’re finally presenting the right answer :-).

Leading the development at combit as Managing Director. Microsoft .NET enthusiast driving innovation & agile project management. Used to be a physicist in my first life. I love hiking and vanlife.