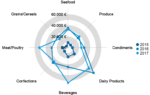
SVG is at the core of this new feature. All browsers offer a decent Scalable Vector Graphics rendering – even on mobile devices. If you’re not familiar with SVG, as you can guess by the name, the format is scalable and vectorized, i.e. you can zoom into any region without losing quality. A picture’s worth a thousand words here:
LL23:

LL24:

Note the much smoother curve on the rim of the donut. Also, the text rendering is much better in LL24. For line charts, the change is even more striking:
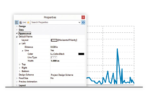
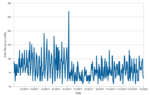
LL23:

LL24:

Note the jaggies (staircase effects) in the old image. LL24’s version is crisp and non-jagged. All chart types profit from this change. We’ve also extended it to shapefiles and barcodes. And of course the Report Server uses XHTML as its base format and thus will also get a much nicer rendering.

Leading the development at combit as Managing Director. Microsoft .NET enthusiast driving innovation & agile project management. Used to be a physicist in my first life. I love hiking and vanlife.