Everything you currently need to know about Web & Cloud Reporting with List & Label.

Back- and front-end: which technologies should be used?
The first question was, which back- and front-end technologies to use. For the back-end, we opted for ASP.NET MVC, as this is the framework already used for the current Web Designer’s back-end. This means, it will be a breeze to integrate the new designer into already existing applications. Supported frameworks are .NET Framework 4.7, .NET Core 3.1 and the new .NET 5. As soon as .NET 6 will be released – which will be sometime in November 2021 – it will be added to the portfolio as well.
More information regarding the switch from the old Web Designer to the new Web Report Designer (spoiler alert: it’s very easy) will follow in a later blog post. The requirements for the server that is hosting the back-end remain the same. This means, it has to be a Windows server with an IIS installed.
For the front-end, we used React in combination with Bootstrap and Redux, as we already made very positive experiences with the Report Server combining these technologies.

(Click the image for a larger view)
During the initial planning phase, we defined the most important requirements for the new Web Report Designer:
- The Web Report Designer should run on all common browsers.
- The front-end should be easy to implement in all common JavaScript frameworks.
- The possibility to open existing List & Label reports in the new Web Report Designer.
- The interface of the Web Report Designer was supposed to be optimized for tablets as well.
- A quick and easy way to use existing code from applications using the current Web Designer for the new Web Report Designer.
- It was a priority for us to make sure that existing repositories and database connections could be re-used with only minimal effort.
To integrate the front-end as easily and effectively as possible into existing applications, we were looking at various technologies. First of all, a React component was considered. However, this carried the disadvantage that a simple implementation in existing Angular/Vue projects wasn’t possible. Instead, we opted for Web Components as a technology base. Direflow is a great helper there: it’s a package which automatically converts a React component into a “Web Components” component.
Simply put, Web Components are custom HTML elements that encapsulate the actual code. The HTML structure, including CSS and Javascript, are encapsulated, the resulting code can be used anywhere on a website or web app. The Web Components were published by the World Wide Web Consortium (W3C) in 2012. All common browsers support this standard now.
In order to integrate the new Web Report Designer into the front-end of your application, just include the WebReportDesigner.js and then use the following HTML code:

Project planning down to the last detail
After making these basic decisions, the planning went into detail. The Desktop Designer was carefully examined, and a list of included features was created. Within this list, we prioritized the individual features – in order to choose the ones that definitely needed to be included in the first version. Next step was the analysis of the surface and developing a strategy to transfer it to the web. In order to achieve this, the surface was divided into its individual parts, such as the ribbon bar, the object tree, the properties window or the variables/fields data structure tree. Let’s take the ribbon bar as an example to show how we proceeded from there:
First step, a functional analysis. The result was a precisely defined map of all individual components and their mandatory functionalities. At the same time, we were able to roughly estimate how much time it would take to develop our own component. The advantage of self-written components is – of course – full access to functionality, design and maintenance.
At the same time, we were looking into existing open source projects – e.g. on NPM or Github – which would contain the required functionalities. In general, when making a selection, it’s important to ensure that these projects are well-maintained. For example, we make sure that projects are checked by code analysis and do have frequent commits. Also crucial is a broad base of project members, as well as a wide usage of the project itself. Very important are support options for these projects. Additionally, as a component provider, we have to make sure that licenses that we add to our components do not require any special terms for deployment. That’s the only way to guarantee that List & Label is easy to redistribute to your end users.
Three projects covered what we required, and ended up on a shortlist. Small prototypes were developed, based on these choices. The results were analyzed in several project meetings – mainly in regards to the following topics:
- Complexity
- Maintenance effort
- Design options
- Operating options – especially in regards to mobile support
- Strategic importance – if the component stopped working overnight, what would happen worst case?
As a theoretical comparison, we analyzed the effort of covering certain areas with self-written components. For example, we decided not to use a classic “ribbon menu”, as this would be rather difficult to use on mobile devices. In this case, it wasn’t very complex to write our own component.
For other areas, however, we decided to go with open source components:
- Drag & Drop
- State management
- Query back-end API
- hotkeys
- Color picker
- Editor
After analyzing the individual parts, the first UI mockups were built.

Layout development
The next step: developing the Web Report Designer’s “basic” layout. As a starting point, a solution structure was created, which is mostly based on the standard recommended for React. The structure looks like this:

- All the “assets” are CSS stylesheets, such as Bootstrap.
- The “components” are reusable components that can be used throughout the Designer, such as the “Formula Editor”, “Navigation” components, “Popup Modals/Dialogs”, but also various “TreeView” components.
- The “helper” are helper functions required within the Designer, such as functions for converting the List & Label units, for date variables, for color settings and also for converting types into Typescript
- Various “hooks” have been written, allowing easy access to our Redux Store. For example: in a component, the “useReportParameters” hook grants easy access to report parameters within the project:

(Click the image for a larger view)
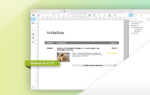
- “layouts”: individual containers for various tasks in the Web Report Designer – in order to achieve this, the Web Report Designer was divided into individual “layout” components

(Click the image for a larger view)
1: “ObjectMenuBarSection”
2: “DesignSpaceSection”
3: “TopMenuBarSection”
4: “ToolsPanelSection”

- “models”: provides all interface definitions for communication with the back-end.
- “pages”: individual components, fulfilling a specific purpose. Those are too specific to be used flexibly, e.g. “BackstageViews” or certain property editors.
- “service_callbacks” and “services”: functions that modify the store (“services”) or take over communication with the back-end (“service_callbacks”)
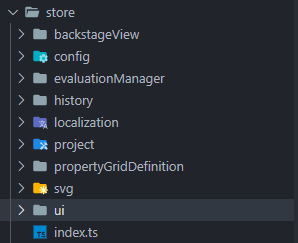
- “store”: different Redux store definitions are saved right here. Again, the “store” is divided into smaller “sub” stores to keep track of things:
The following steps and the challenges we encountered – especially in regards to “Drag & Drop”, “State Management”, “back-end Requests”, “Hotkeys” and “Editor” – will soon follow in the second part of this blog post series – stay tuned!

Benjamin works as a full stack developer at combit. In addition to being a part of the dev team, he is also involved in vocational training. In his free time, he engages for the volunteer fire department.