List & Label Reporting Blog
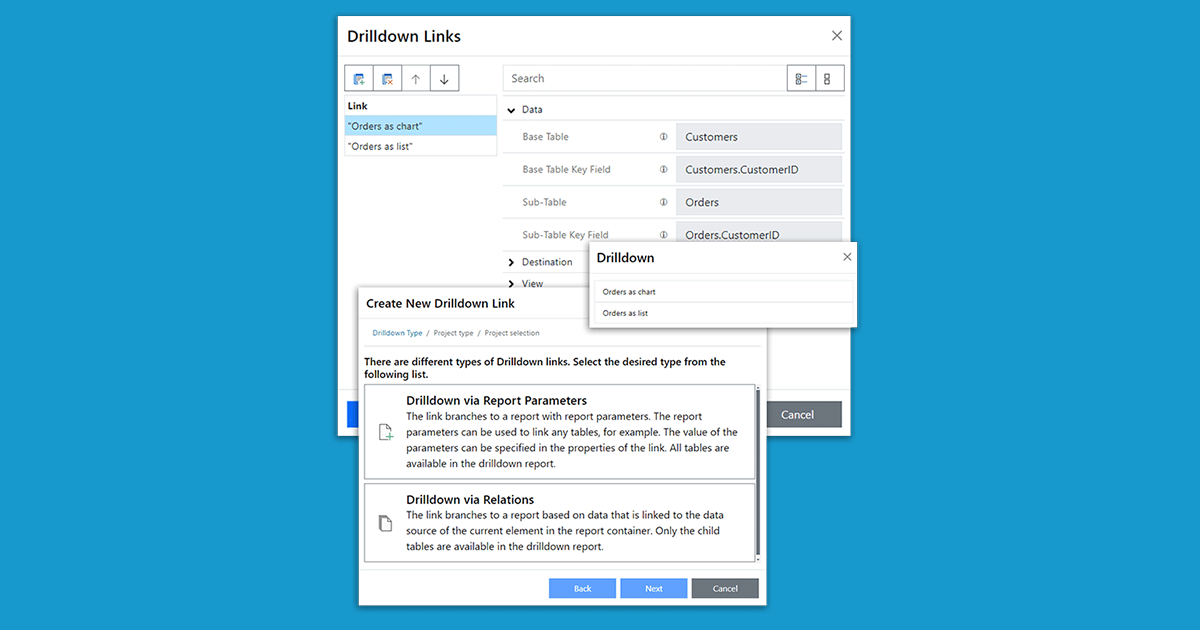
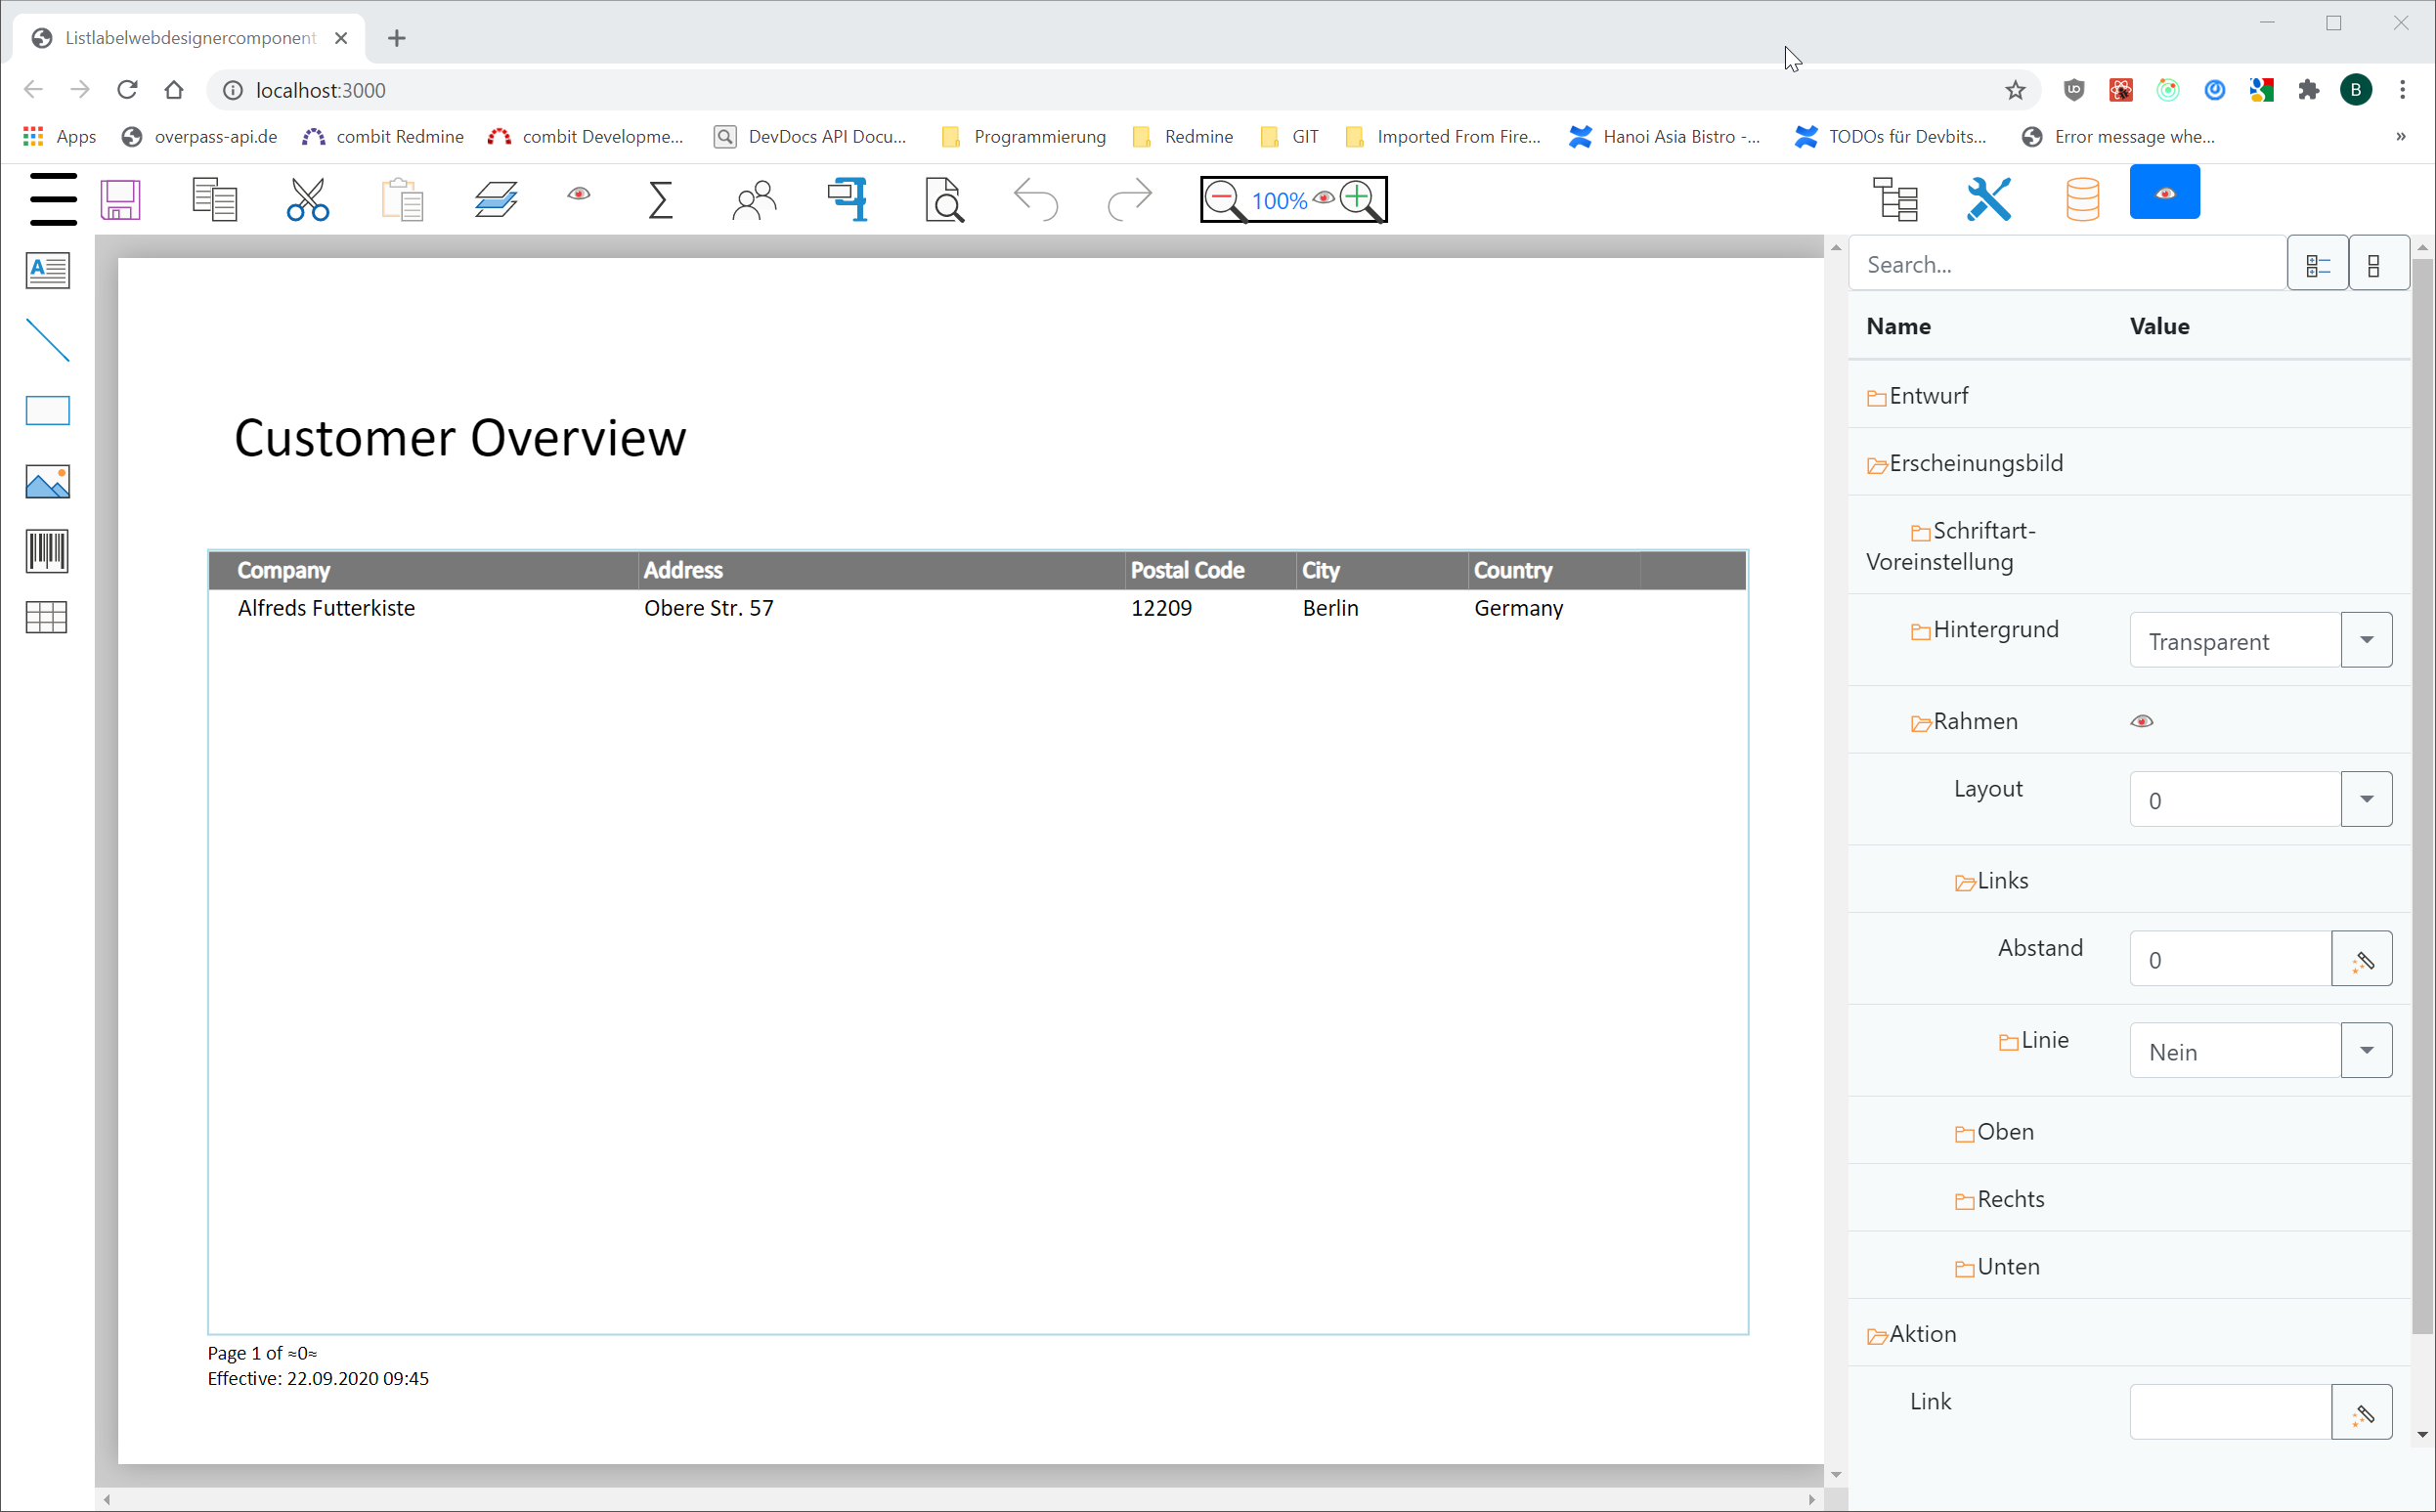
Drilldown in Web Report Designer
Since version 30, the Web Report Designer supports drilldowns. This allows you to implement interactive reports entirely in the browser – including navigation between different detail levels. This feature was previously only available in the desktop designer.
New Service Pack 27.002 for List & Label and the Report Server
The new service pack for List & Label 27 brings many enhancements and improvements especially for the new Web Report Designer as well as for Delphi and .NET developers. In addition, the new drag & drop interface for charts now also supports the selection of an aggregate function. The report template preview in the Report Server uses the new Web Report Viewer, styled according to the applied Report Server customization. Read our blog post for more highlights. The individual entries have been taken directly from the English readme.
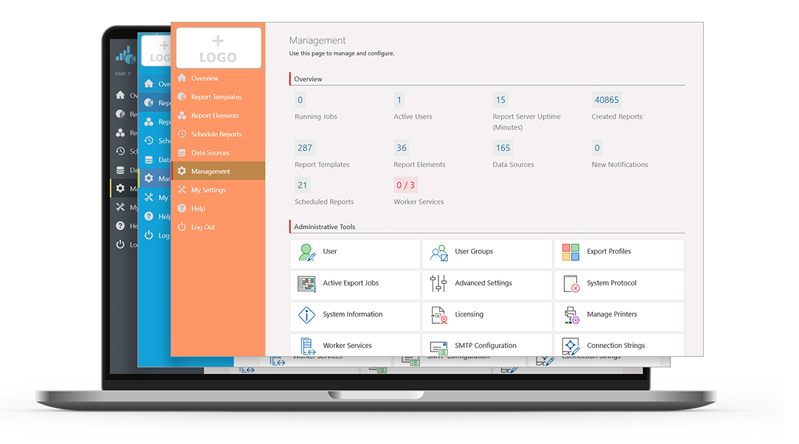
Report Server 27: New Features and Improvements
In the Report Server’s most current version, a few more exciting new features have been implemented, as a response to some customer requests. Overall, the new Report Server now visually integrates better into your application. Also, in addition to new actions for planned reports, it also offers additional enhancements for Excel export. Service Pack 27.001 will provide customers with a completely new preview.
Making-of: Web Report Designer in Development Part III
In the last part of our blog post series, we’ll take a closer look at challenges that came up while developing the Web Report Designer – especially in regards to back-end requests, hotkeys and the formula editor.

New Service Pack 26.005 for List & Label and the Report Server
Besides support for Windows 11, the new Service Pack 26.005 provides many new features and improvements for the Report Designer, print, export, .NET and much more. This blogpost gives you a summary.
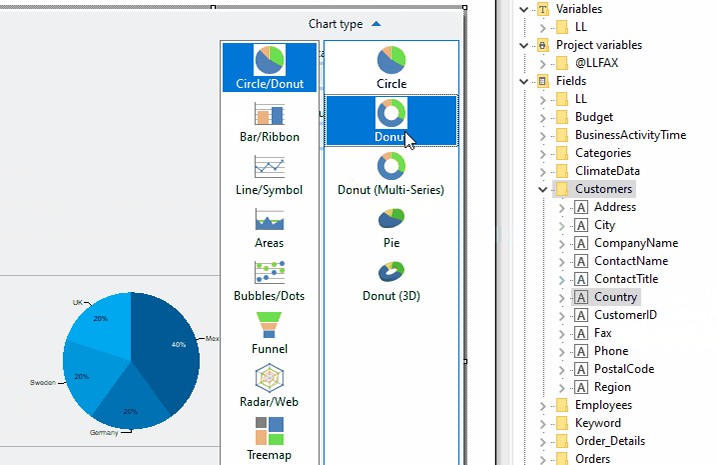
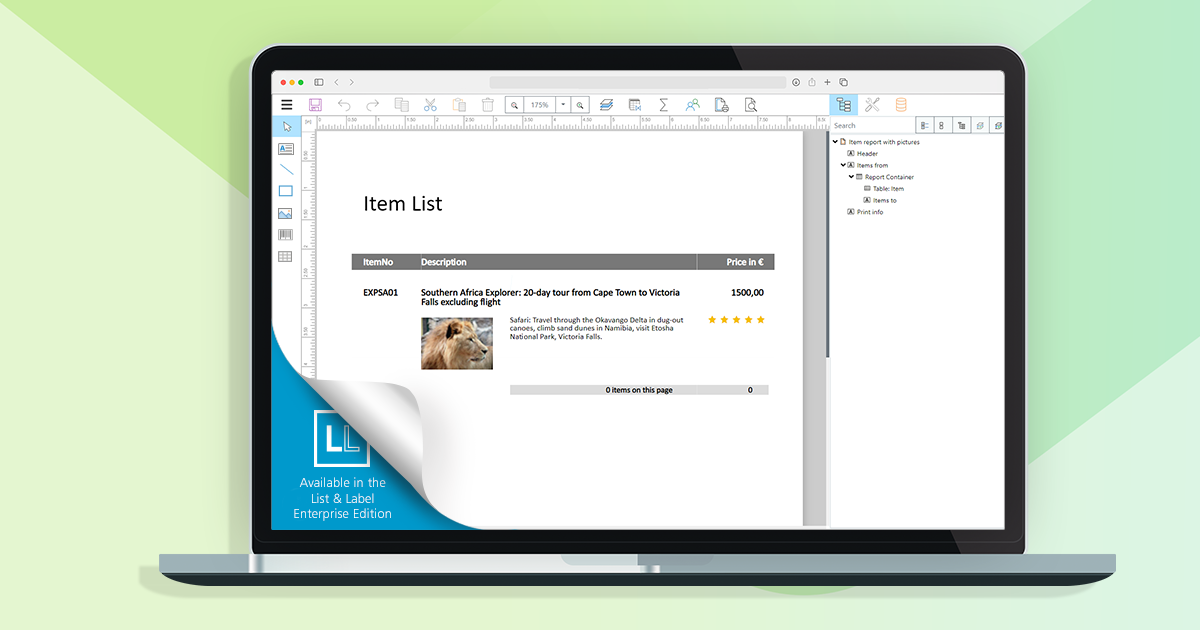
Creating Charts via Drag & Drop
List & Label’s chart dialog offers a load of possible customizations. However, as always, with great power comes great complexity. Even creating a simple pie chart could have taken some time if you’re not yet familiar with List & Label’s chart features. As you can already easily create crosstabs via Drag & Drop, and we just recently improved the table’s drag & drop features, offering a thorough D&D support for charts was the next logical step on our path to a simpler, more intuitive end user desktop designer.

No More Printer Driver Dependency: The New Printerless Mode in List & Label 27
This was a huge issue, that has been bugging us for years. While – generally speaking – List & Label’s level of printer control is unmatched by any competitor I know of, we always required a printer driver in order to execute this control. On the desktop, that’s all fine and well, as Microsoft conveniently provides the XPS Document Writer and – in more recent versions of Windows OS – the Microsoft PDF Writer. Those are always present and accessible. However, on the web and in the cloud, it’s a different story.
Making-of: Web Report Designer in Development Part II
In our last blog post, we already announced it: this time, we’d like to address further challenges we encountered during our development of the Web Report Designer. Take advantage from what we learned, and maybe even use some bits for your own projects.
New Service Pack 26.004 for List & Label and the Report Server
The Service Pack 26.004 has some new features and various improvements for you. We give you an overview of what’s new and what has improved.
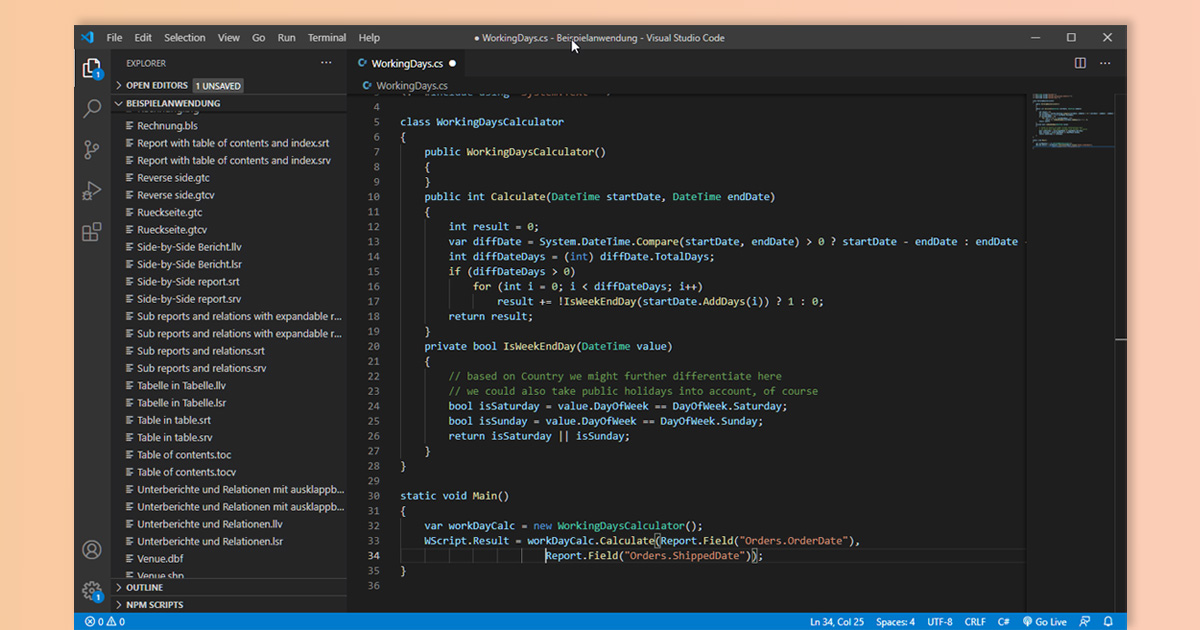
Revisiting C# Script Performance
This is another often overlooked feature – you can add scripts to your projects and use your favorite language to do so. Since a couple of versions already, List & Label supports C# Scripts. However, the performance was less than perfect, making it a good choice for complex calculations but not so much for using it on a line-to-line base. In List & Label 26, we were able to push the performance quite remarkably – now using scripts is perfectly feasible.
Making-of: Web Report Designer in Development Part I
The rapidly increasing number of web apps has led to a great demand for web-based reporting solutions. We followed this trend with List & Label, and moved the Designer to the web – from version 27 on. One huge benefit, brought by the new Designer: way less effort, because only one front- and back-end needs to be developed and subsequently maintained. Naturally, the development of the new Web Report Designer presented us with technical challenges which we’d like to share with you – maybe knowing about our own learning curve is going to help you with your own projects, too.


