New Connection to Microsoft Flow for the Report Server

Microsoft Flow allows you to define your own processes and workflows based on various triggers. More than 200 services such as Office 365, Facebook, WordPress etc. are available for this purpose, which can interact with each other in the workflows (called flows). These services offer actions as well as triggers, such as when a file is created (on Google Drive, DropBox or also on alternative services like e.g. box) or when a mail is received. Each flow has a trigger and may have multiple actions. This article describes how to connect combit Report Server to Microsoft Flow.

New Apps for the combit Report Server

ios app combit report server

This post belongs to a series of blog posts that are dedicated to the innovations of combit Report Server 24. At this point I would like to recommend the two posts "What's New in Report Server 24, Part 1" and "What's New in Report Server 24, Part 2".

Today we are talking about the new native iOS and Android apps for the combit Report Server, which allow you to access the reports on your Report Server directly from your smartphone or tablet. Previously, this was also possible directly via the Report Server web interface, but the new apps offer additional options and a device adapted and fast operation, as you would expect from a native app.

Use Rscript Visualizations for Your Reports

rscript for data visualization

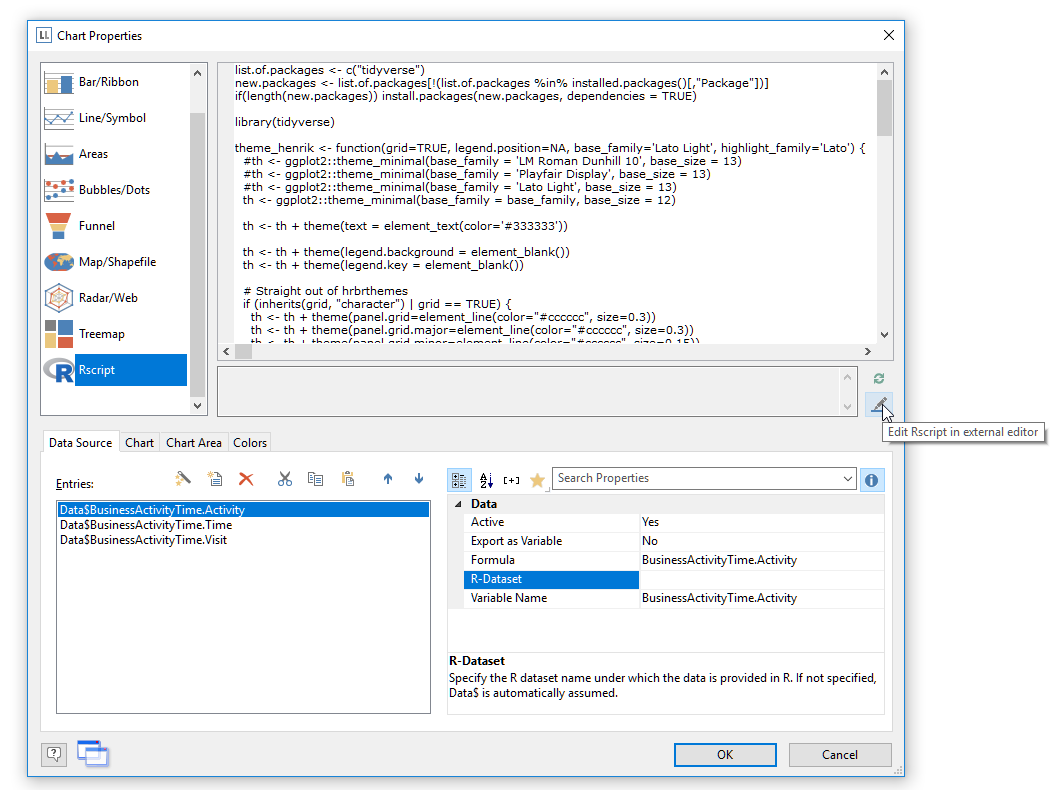
While List & Label's charts offer a lot of visualization types and are extended almost every version, there are way too many visualization types to support them all. Thus, requests for new chart visualizations keep bubbling up in our feedback portal. On the other hand, Rscript is a well established language specialized for statistical computing and graphics that supports any visualization I can think of. So it absolutely makes sense to add Rscript output to the available chart visualization and include the best of both worlds – List & Label's versatility for report layout and data access and Rscript's deluge of visualization types. And that's just what we did for the Enterprise Edition of List & Label 24.

Reporting REST with parameters, authenticating via tokens with the Report Server 24

This is the first of two blog posts presenting the new features of our combit Report Server in the upcoming version 24. Since the last version, in which the Report Server has become part of our List & Label developer component, the development teams of both products have been working even more closely together. This enables us to better coordinate the needs of both products, and thus also of our customers.

Introducing Parametrized Data Sources

example for a result in the html 5 viewer

List & Label's powerful filter options could not be used for all data sources so far. Reason is, especially for web based data sources, it is not possible or feasible to get "all" data first and then filter to the desired subset. The upcoming version 24 comes with a powerful new feature that addresses this very issue: Parametrized Data Sources. It allows to combine data source parameters with actual report parameters in the Designer.

Fun With the Major Upcoming Winter Sports Event in Pyeongchang

As you might know, this year’s Winter Sports Event will start just by the end of the week. I have to circumlocate the actual name of the event as those people really mean “Trademark” when they say it. Let’s call it simply “Games” for the rest of this article, which hopefully should be safe. Anyway, I thought this would be a good opportunity to do some statistics with my favorite reporting tool.