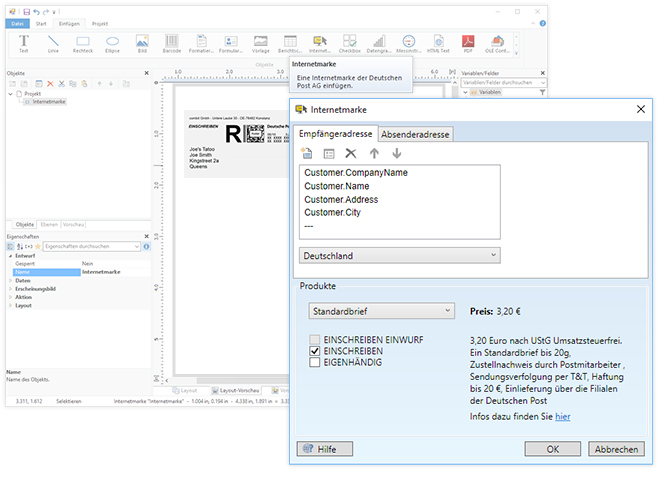
Mingling with the Progress Community @ EMEA PUG Challenge
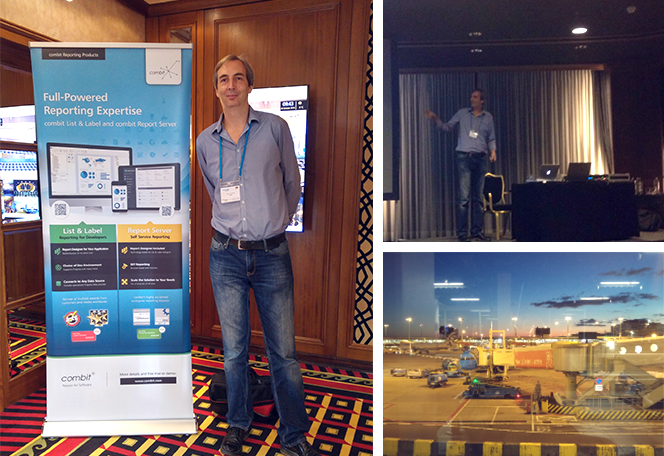
From time to time it's great fun to stray off the beaten .NET path to venture into other developer's hemispheres. This time I paid a visit to the great crowd at the EMEA PUG Challenge in Noordwijk/Netherlands to dig into the Progress community.