In the Designer, the various interaction options are configured, which the user can then use later in the preview. These elements enable the user to easily and effectively extract a great deal of information from such a dynamic report without further configuration effort.
Drilldown/Drillthrough
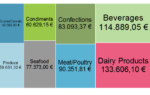
Drilldown reporting refers to the navigation through different levels of detail in hierarchical data. It allows you to “zoom in” on the data and view it at different levels of detail. For this purpose, various print templates are linked together in List & Label.
Initially, only an upper level is output to the preview, for example, a list of customers (“master report”). By clicking on any customer, a new report (e.g. orders) is opened (“detail report”). This report contains details of the record that was clicked on before. In this way, you can click your way through the report one by one until, for example, you reach the individual items of an order. Even with large and complex data sets, you can quickly find the information you need.
This step-by-step deepening of the data enables you to find your way around complex and large databases quickly. Drilldown works in List & Label at any depth and can be used for table rows or fields as well as for charts in combination with report parameters (see below for details).

To be able to design drilldown reports, it is usually necessary that relations are included in the data source. If you use the .NET or VCL components, hierarchical structures in your data are automatically recognized and passed to List & Label. 1:n and 1:1 relations are thus available in design and print and can be used for drilldown reports. With other programming languages, you transfer the database tables using special commands, including existing relations and sorting.
Tip: If no relations are available in the data source, report parameters can also be used to create a drilldown report. More about this can be found further down in the section “Report parameters”.
Expandable Regions
Basically, an expandable region is the “little brother” of a drilldown report. Simply activate the function in the List & Label Designer using the “Expandable Region” property of a table. The only requirement is a master-detail layout.
An example would be the listing of all order details (detail table) of an order (master table). The order details are derived from the orders with the help of a relation. In the preview, you initially only see the list of purchase orders for a customer. A small arrow is displayed next to each row, indicating that further information can be found “below”. A click on the arrow opens the details for the line. This gives you a drill-down option without leaving the current preview and without having to design a separate project for it.

Tip: If no master-detail layout is available, expandable regions can also be used within a single table. A prerequisite for this is then that groupings are used. The property can be activated for each group header. For more details, see the article “Extending “Expandable Regions to Groups”.
Report Parameters
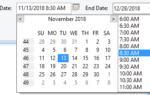
Parameters can be used to conveniently filter the database directly in the preview. For example, a date range can be selected or only certain invoice numbers can be printed. The user can then decide which data is currently filtered in the report without having to create a new layout or, even worse, reprocess the data source in the application. The parameters are displayed separately in the preview and can also be used as variables, for example in filters. If a report with parameters is printed or exported directly, the parameters are queried via a dialog box before output.

Report parameters can also be used to create a drilldown report that is not based on a relational data structure. To do this, the drilldown report can be defined using Drilldown via Report Parameters. The value of the report parameter is then passed on to the drilldown report, where it can be used as a data filter for a table or a chart, for example.
Tip: In the Standard Edition of List & Label the maximum number of possible report parameters is limited to 1.
Interactive Sortings
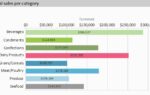
With the ability to directly change sort orders for a table, users can easily and conveniently arrange the data in the preview. This makes it possible, for example, to sort a table of customers in ascending or descending order by different fields without having to adjust the sort order in the print template. The corresponding arrows in the table header indicate to the user that this column can be sorted.
This flexible layout covers several use cases at the same time. The benefit: There is no need to create several templates just because the data is to be displayed in a different sequence/sorting.

Form Controls
The user is also able to enter or add data directly in the preview. The List & Label Designer provides form controls for this purpose. There are different types, which differ in their use and functionality:
Edit: This is a classic, single or multiple line input field for entering characters or texts.
Checkbox: Can have two states. The user can choose whether something is selected or not.
Combo box: The user selects an entry from a given list or optionally adds an entry himself, if it is not available in the given list.
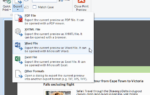
Button: This button can be used for different tasks, for example, triggering the sending of an email, saving the preview file, triggering an http-post or starting a simple link like an internet address. For PDF export, this button can also be set to create a signature field to start the signature process in the PDF application.

Tip: One advantage of the form controls is that they are largely retained after the PDF export and can be used in the PDF document by the user.
Animations and Presentation
Through animated objects, the preview assumes the task of a presentation program, similar to Microsoft PowerPoint. Animations such as wipe, stretch, fade, pop up and many more are available and can be used for text objects, diagrams or images.
The trigger for the animation is freely selectable. You decide whether the animation starts directly when the preview page is shown or dependent on other objects or is only triggered by a mouse click. In addition, the delay and duration of the selected animation can also be determined. If the report is exported to XHTML, you can also set specific animations for individual objects, which are then played back in the browser when the report is displayed.

Tip: In addition to the preview, List & Label also supports the possibility to show a report directly in full screen mode. This allows you to replace PowerPoint presentations in order to present reports, for example in meetings. You can define various transformations for page changes to bring life to the presentation of a report.
Find and Copy Texts
With the help of the find function you can find important information in the preview. The results are highlighted directly in the preview. You can also do case sensitive searching.

Once you have found the required search hit, it is easy to select text in order to copy it directly from the preview and thus transfer the information to other applications.

Links
Numerous objects in the List & Label Designer have a “Link” property. A URL can be stored here that is called up when the object is clicked. This allows the use of standard Windows protocols such as http/https, file, mailto etc. But of course, you can also use your own protocols, which are then processed by the application. They support, for example, the direct jump to the detailed data record in the CRM system that belongs to the respective data row.
Tip: Links with standard protocols are also retained in the PDF export and can usually be called up there if the viewer and local security settings allow this.
There are thus a number of possibilities to make the preview of a List & Label report very dynamic, flexible and interactive. This usually leaves nothing to be desired in order to present the user with a report experience. More detailed information on the individual sections and topics can of course be found in the Designer manual.
Developer’s Tip: Drilldown, expandable regions, report parameters and interactive sorting in reports can also be used in the Web Report Viewer for your own .NET Web applications and thus work in any browser. And since the combit Report Server also uses the Web Report Viewer as a web control, these elements also work there. You can find a short overview under Web & Cloud Reporting with List & Label.

Daniel has undergone training as a software developer at combit, where he currently leads the Customer Support department as a manager. His responsibilities extend beyond software development to include technical collaborations with business partners. He conducts workshops for developers and serves as a technical advisor to the sales and service team. Outside of work, Daniel is an avid cyclist, frequently seen navigating the trails around Lake Constance and the neighboring Alps on his mountain or road bike. Additionally, he dedicates time to practicing Chinese martial arts, including Wushu Kungfu and Taichi.


Is there any new example of how to implement all of these new feautures in my Alaska xbase++ language ?
Hi John,
a couple of these features are available for Xbase++ as well: Form Controls, Animations, Find and Copy Texts as well as Links.
Using the dsListLabel component, the real data preview is still available, all other interactive features can be programmed using the callback slots provided by the component.
Further automatically available interactive features are planned for version 26
Kind regards
Erdal
Hi!
I’m trying to implement the PDF Signature field as states above: “this button can also be set to create a signature field to start the signature process in the PDF application”. Sadly the button/field never appears on my PDF when generating them. What could be wrong? All “button” types don’t appear. I.e. a checkbox does appear on the PDF…
Thanks for the help.
The signature button would be the only one visible in the PDF. Maybe you could head over to our forum at https://forum.combit.net and create a thread there? This would allow to include screenshots and is a better format to tackle this question.
Hello, is there any way to design a report from code?
The scenario is as follows:
To make preview, you need a design, I know.
The thing is that in my application, I should be able to preview the different listings, taking into account the current view of the listing.
So when I call preview, I’ll pass the fields to view, but since there has to be a design for preview, I’ll have to have a default design, but the layout will have to be built dynamically based on the fields in the datasource that I feed dynamically.
Is there any way of creating the design (a table) and adding the fields via code?
Hi Domingos,
Sure, you can simply use our object model (“DOM”) to do so. Depending on your programming language you will find samples for the usage of the DOM in your installation folder. For .NET, here’s a primer:
https://docu.combit.net/net/en/Object%20Model%20(DOM).html
and here’s a sample:
https://github.com/combit/ll-samples/tree/main/Microsoft%20.NET/.NET%20Framework%204/WinForms/Simple%20DOM%20Sample
Also, feel free to reach out at https://forum.combit.net if you require further assistance.
I’m using list&labels to integrate a web app with angular.
So I’m using webreportviewer and webreportdesigner.
I need to design from code, and the project type as ‘list’, set the header, row lines according the fields received.
Let’s continue the discussion here: https://forum.combit.net/t/create-a-design-by-code-in-a-web-application/11121/2
The fact you’re using a web application makes no difference to List & Label here.