List & Label Reporting Blog
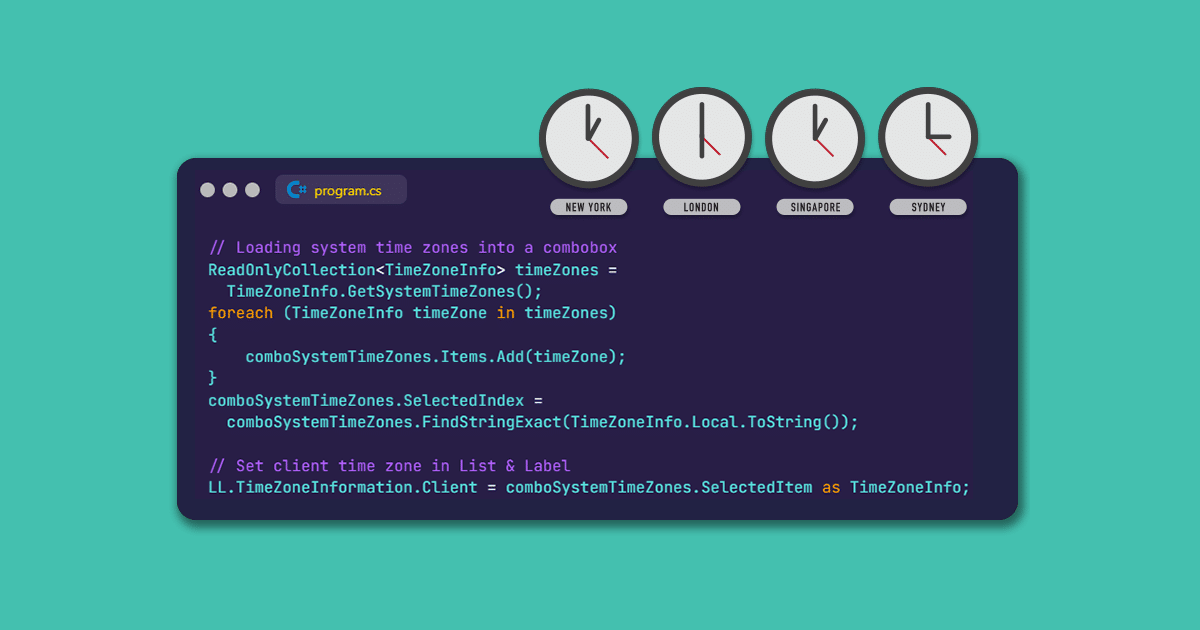
New time zone function in List & Label: solutions for complex reporting requirements
In the world of server-based reporting, there are often challenges in connection with different time zones. The complexity increases in particular when the database server, the … Read more

New Connection to Microsoft Flow for the Report Server
Microsoft Flow allows you to define your own processes and workflows based on various triggers. More than 200 services such as Office 365, Facebook, WordPress etc. are available for this purpose, which can interact with each other in the workflows (called flows). These services offer actions as well as triggers, such as when a file is created (on Google Drive, DropBox or also on alternative services like e.g. box) or when a mail is received. Each flow has a trigger and may have multiple actions. This article describes how to connect combit Report Server to Microsoft Flow.
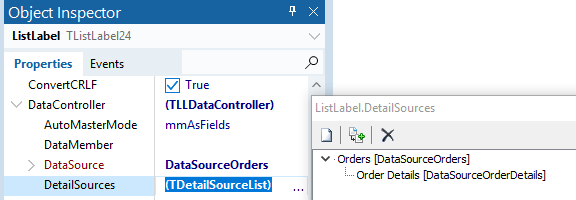
New VCL Component for Delphi Developers
It’s been a while since the original announcement back in June 2016, but hey, we’re finally there. Today marks the release of a brand new VCL component that uses the data provider interface and FireDAC at its core.
New DataProvider for Redis
Redis is an in-memory key-value database, so a typical NoSQL database. Since its initial release in 2009, it has become quite popular and now is, according to db-engines.com by far the most popular key-value database out there. With the new RedisDataProvider you can now use your Redis database within List & Label or Report Server.
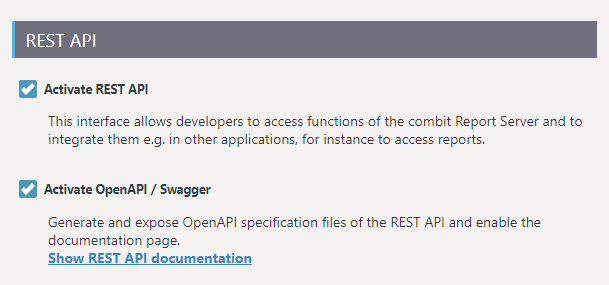
Swagger and OpenAPI Support for Report Server REST API
The OpenAPI Specification (OAS) defines a standard interface description for REST APIs, which allows both humans and computers to discover and understand the capabilities of a service without requiring access to source code, additional documentation, or inspection of network traffic.
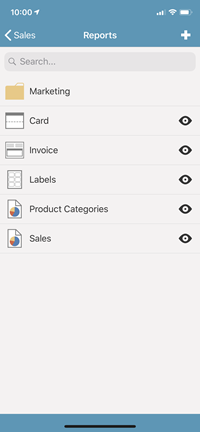
New Apps for the combit Report Server
This post belongs to a series of blog posts that are dedicated to the innovations of combit Report Server 24. At this point I would like to recommend the two posts “What’s New in Report Server 24, Part 1” and “What’s New in Report Server 24, Part 2“.
Today we are talking about the new native iOS and Android apps for the combit Report Server, which allow you to access the reports on your Report Server directly from your smartphone or tablet. Previously, this was also possible directly via the Report Server web interface, but the new apps offer additional options and a device adapted and fast operation, as you would expect from a native app.
Today we are talking about the new native iOS and Android apps for the combit Report Server, which allow you to access the reports on your Report Server directly from your smartphone or tablet. Previously, this was also possible directly via the Report Server web interface, but the new apps offer additional options and a device adapted and fast operation, as you would expect from a native app.

Miscellaneous Treats in LL24
While I've been blogging about the major and most-UI-visible features during the last few months, of course there are gazillions of minor and less visible changes underneath the hood in LL24. This blog post sums up some more reasons to be cheerful.
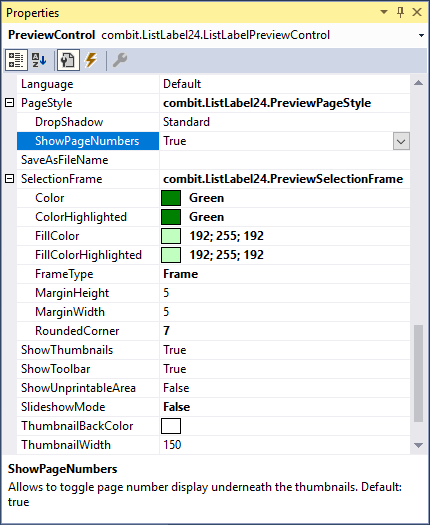
Customizing the Preview’s Look & Feel
Since the introduction of our feature portal three years ago, it has become an important driver for our innovation. If you filter for "available in latest version", you'll find some fourty features we've built into the product on your request. So here comes a big "thank you" to everyone participating! Your help, effort and ideas are more than welcome anytime. Of course, we've implemented some of the top voted demands into LL24. One of them has been to enable the customization of the preview window's look and feel.
Add Your Custom Objects and Functions to the Web Designer
Extensibility is a first class citizen in the List & Label universe. You can add your own functions and objects to the Designer, enabling complex calculations within your code or custom objects. However, there was one important link missing so far – all this code just runs on the desktop. If your application runs on a server and you're using the Web Designer you're hosed – until version 24.
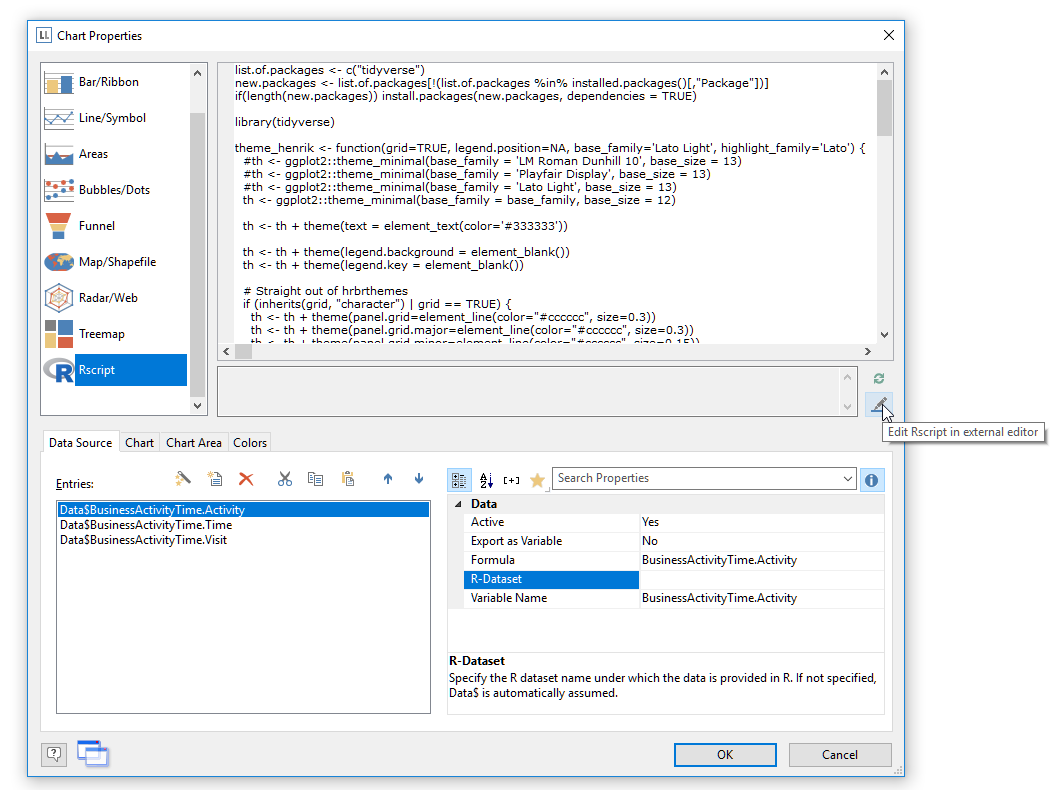
Use Rscript Visualizations for Your Reports
While List & Label's charts offer a lot of visualization types and are extended almost every version, there are way too many visualization types to support them all. Thus, requests for new chart visualizations keep bubbling up in our feedback portal. On the other hand, Rscript is a well established language specialized for statistical computing and graphics that supports any visualization I can think of. So it absolutely makes sense to add Rscript output to the available chart visualization and include the best of both worlds – List & Label's versatility for report layout and data access and Rscript's deluge of visualization types. And that's just what we did for the Enterprise Edition of List & Label 24.
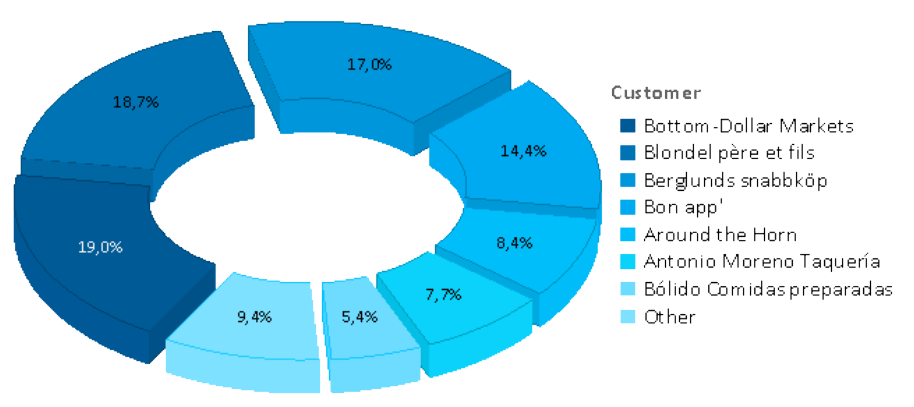
Vastly Improved Chart Rendering in the Browser
Over the years, we kept improving our chart engine with each version. We've added Donut, Radar and Treemap charts and offered new layout options. However, if your charts were to be rendered in the browser, the only available formats so far have been PNG or JPEG, leaving you with exactly two options: either have great quality and huge file sizes or a swift download and poor rendering quality. There was no option to combine both (and I'm not thinking "huge download and poor quality" here <g>). In LL24, this is going to change.


