List & Label Reporting Blog
New Service Pack 30.002 for List & Label and the Report Server
The latest service pack 30.002 for List & Label brings form controls to the Web Report Designer and Web Report Viewer, adds RAD Studio 12.3 support, and expands flexibility for OData sources in the Report Server.

Reporting REST with parameters, authenticating via tokens with the Report Server 24
This is the first of two blog posts presenting the new features of our combit Report Server in the upcoming version 24. Since the last version, in which the Report Server has become part of our List & Label developer component, the development teams of both products have been working even more closely together. This enables us to better coordinate the needs of both products, and thus also of our customers.
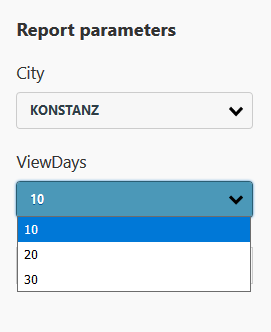
Introducing Parametrized Data Sources
List & Label's powerful filter options could not be used for all data sources so far. Reason is, especially for web based data sources, it is not possible or feasible to get "all" data first and then filter to the desired subset. The upcoming version 24 comes with a powerful new feature that addresses this very issue: Parametrized Data Sources. It allows to combine data source parameters with actual report parameters in the Designer.
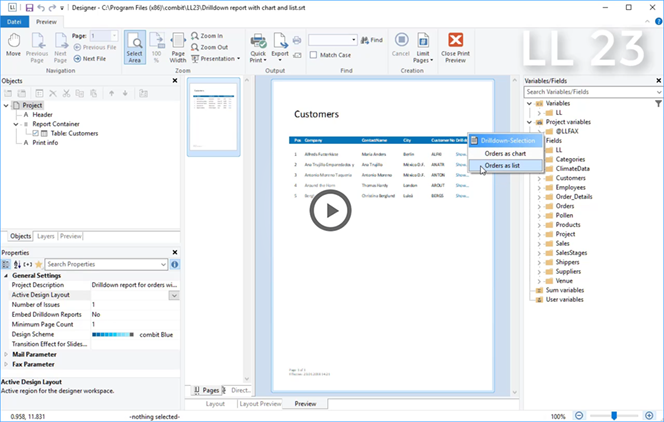
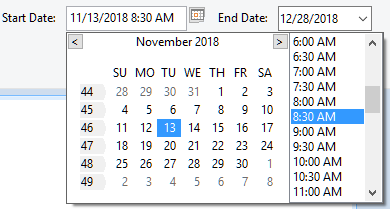
Seamless Change of Displayed Preview
As you may have guessed, by now we are well into working on version 24 of our List & Label reporting tool, which is due to be released this fall. Today I proudly present the first feature preview!
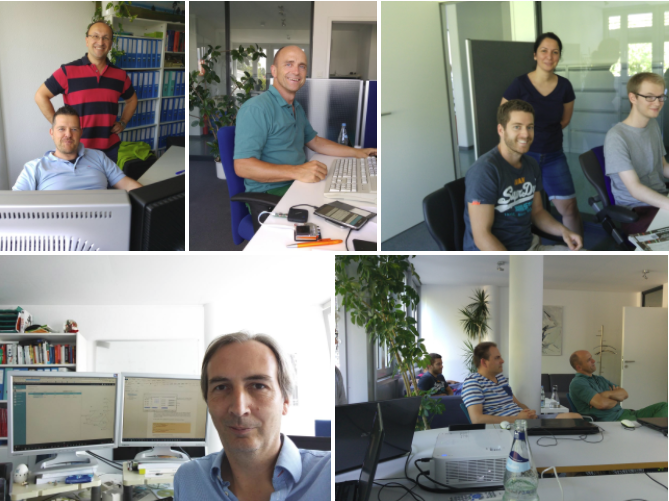
Our Most Popular Resources for Developers
Let's be honest, developing has it's challenges. To meet the ever more diverse demands on applications and technologies, we all rely on a multitude of ressources to make our lives easier. So we, the makers of your favorite reporting tool, thought it's about time to let you benefit from our experience. Below you will find just a small selection of the tools that we can't do without.
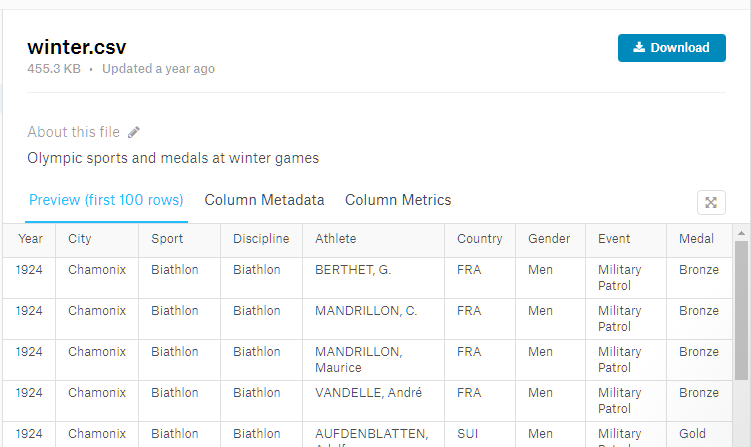
Fun With the Major Upcoming Winter Sports Event in Pyeongchang
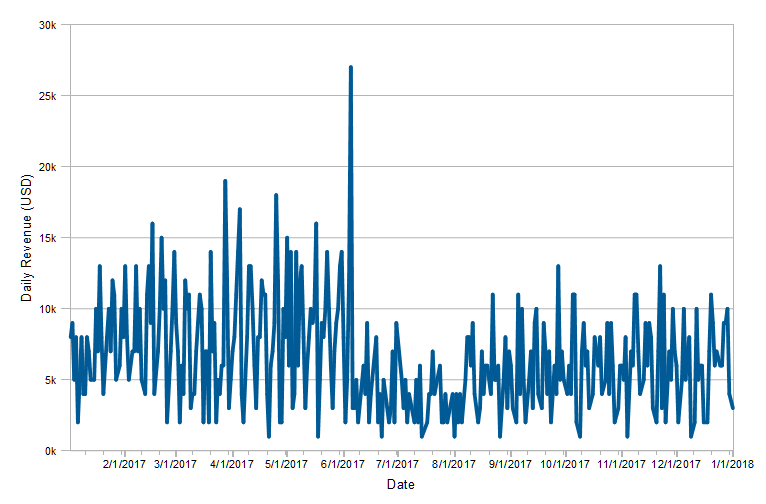
As you might know, this year’s Winter Sports Event will start just by the end of the week. I have to circumlocate the actual name of the event as those people really mean “Trademark” when they say it. Let’s call it simply “Games” for the rest of this article, which hopefully should be safe. Anyway, I thought this would be a good opportunity to do some statistics with my favorite reporting tool.
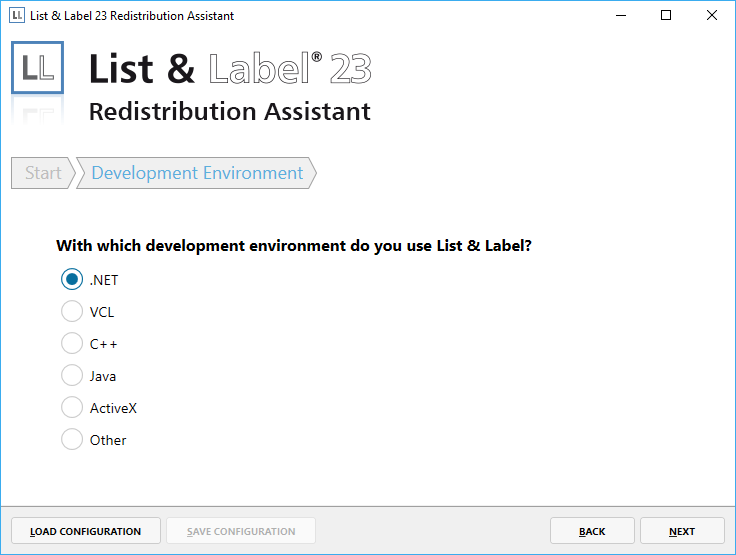
Simple List & Label Redistribution with New Assistant
The compilation of the redistributable files of List & Label has been somewhat cumbersome so far. But we listened to the wishes of our customers and developed an easy-to-use redistribution assistant.
Miscellaneous Treats in LL23
While holiday season is approching fast, bringing some well-deserved quality time off work for all of us, I briefly wanted to share some miscellaneous treats in version 23 of our List & Label reporting tool with you.
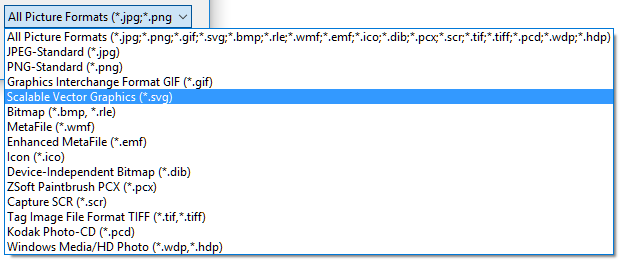
Supporting SVG as Image Format
The Scalable Vector Graphics format has been around for quite a while. The first specification was released in 2001, and meanwhile all browsers offer solid support for SVG. During the years, we've received a couple of requests to support SVG in List & Label. Initially, I was hoping for Microsoft to make SVG rendering support a Windows feature that we could just use. However, that hasn't happened so far. And so we had to come up with a different solution.
Signal Ranges Extended to Charts
The signal ranges are a handy gauge feature to highlight parts of the scale. It enables you to divide the scale e.g. into a green, yellow and red part. That way, you can judge at a glance if a value is "good" or "bad". In LL23, this feature has been extended to charts.
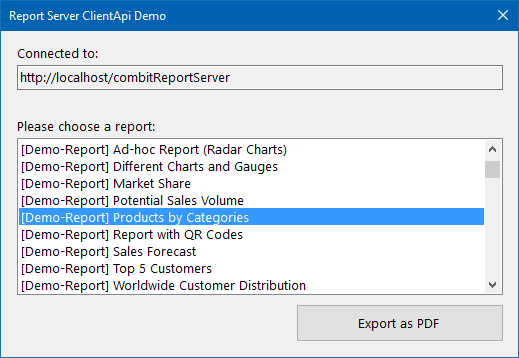
Brand-New Component: „combit.ReportServer.ClientApi“
Have you ever wanted to migrate your List & Label projects and data providers to a central webserver to export and view them on an Android or iOS tablet with just a few lines of code? With the upconing new version 23 we have some good news for you!


