List & Label Reporting Blog
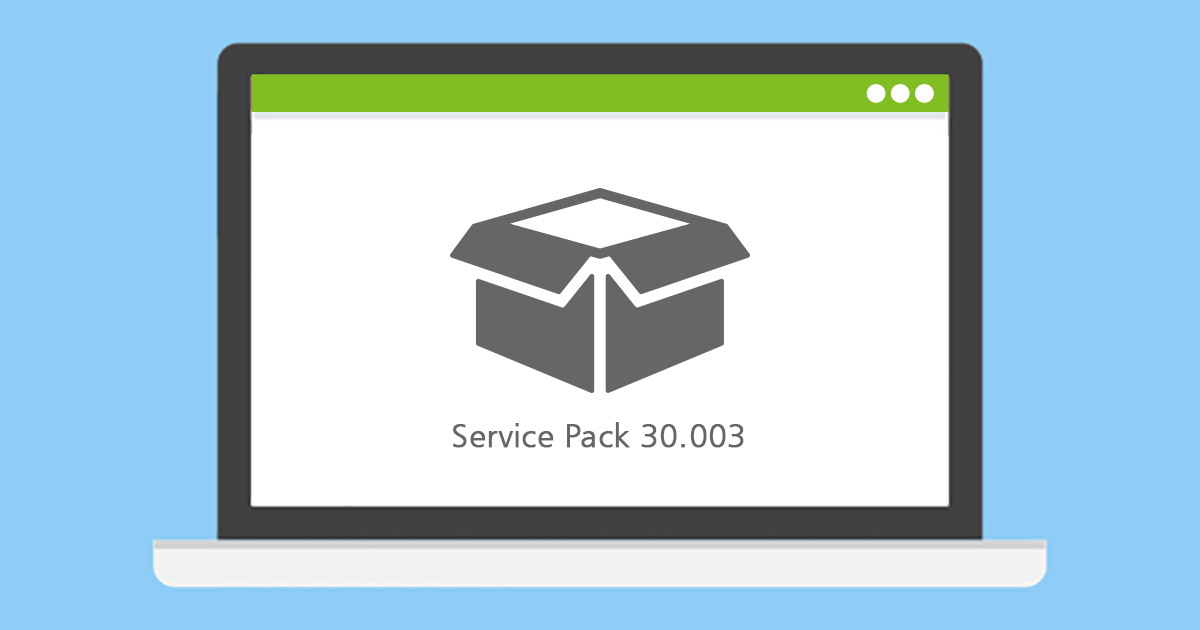
New Service Pack 30.003 for List & Label und the Report Server
The latest service pack 30.003 for List & Label adds Windows 11 25H2 support, introduces a new datastructure tree component in the Web Report Designer, improves performance for large projects, and increases the maximum number of print passes to 1000.

Innovations for Planned Reports and more | New in Report Server 24 – Part 2
This is the second blog post covering the new features of combit Report Server version 24.
I already introduced some new features in the Ad-hoc Designer.
How to Use List & Label .NET Directly in Java
With the help of Javonet, the List & Label .NET component can be easily integrated and used directly from Java – with the usual ease of use you are accustomed to from .NET. With this cooperation, Java customers have easy access e.g. to real data preview in the Designer, drilldown reporting and report parameters to name just a few of the interactive features.
Customer Wishes Implemented in the Ad-hoc Designer
Since version 3 of the Report Server, you can create reports quickly and easily with the Ad-hoc Designer. Since List & Label 23, this feature is also available for .NET developers for integration into their applications. Today I would like to show briefly which customer requests we were able to implement in combit List & Label 24 and Report Server 24 in the Ad-hoc Designer.
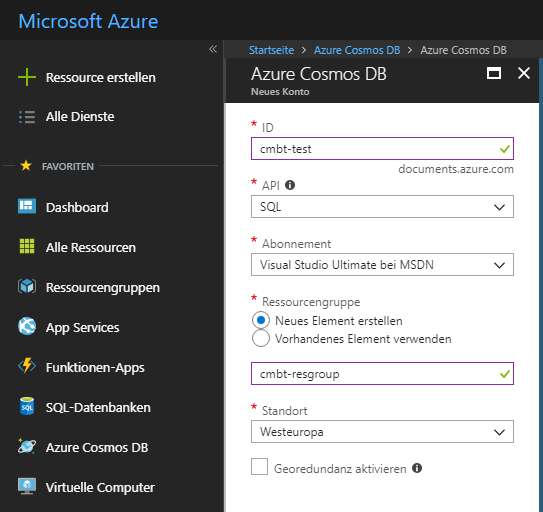
Connect to Microsoft’s Cosmos DB with Reporting Tool List & Label
Microsoft’s Cosmos DB is a cloud based, scalable database service that has become quite popular since its initial launch in May 2017. I thought it might be a nice idea to check it out and – while I’m at it – see how I can connect my favorite reporting tool to it.
Reporting REST with parameters, authenticating via tokens with the Report Server 24
This is the first of two blog posts presenting the new features of our combit Report Server in the upcoming version 24. Since the last version, in which the Report Server has become part of our List & Label developer component, the development teams of both products have been working even more closely together. This enables us to better coordinate the needs of both products, and thus also of our customers.
Introducing Parametrized Data Sources
List & Label's powerful filter options could not be used for all data sources so far. Reason is, especially for web based data sources, it is not possible or feasible to get "all" data first and then filter to the desired subset. The upcoming version 24 comes with a powerful new feature that addresses this very issue: Parametrized Data Sources. It allows to combine data source parameters with actual report parameters in the Designer.
Seamless Change of Displayed Preview
As you may have guessed, by now we are well into working on version 24 of our List & Label reporting tool, which is due to be released this fall. Today I proudly present the first feature preview!
Our Most Popular Resources for Developers
Let's be honest, developing has it's challenges. To meet the ever more diverse demands on applications and technologies, we all rely on a multitude of ressources to make our lives easier. So we, the makers of your favorite reporting tool, thought it's about time to let you benefit from our experience. Below you will find just a small selection of the tools that we can't do without.
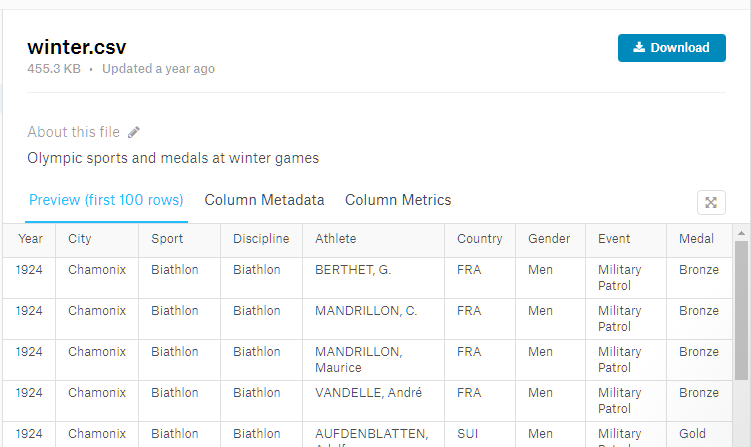
Fun With the Major Upcoming Winter Sports Event in Pyeongchang
As you might know, this year’s Winter Sports Event will start just by the end of the week. I have to circumlocate the actual name of the event as those people really mean “Trademark” when they say it. Let’s call it simply “Games” for the rest of this article, which hopefully should be safe. Anyway, I thought this would be a good opportunity to do some statistics with my favorite reporting tool.
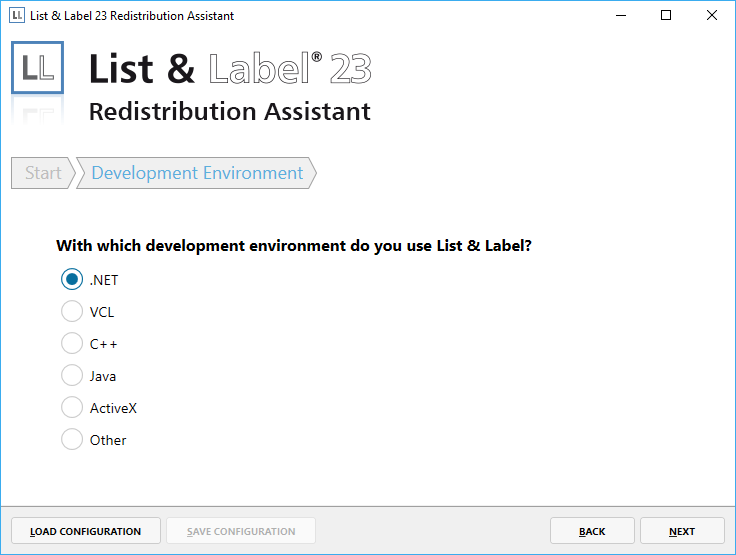
Simple List & Label Redistribution with New Assistant
The compilation of the redistributable files of List & Label has been somewhat cumbersome so far. But we listened to the wishes of our customers and developed an easy-to-use redistribution assistant.


