Interactive Reports with List & Label

Today, modern reports must be designed for more than just one purpose. In addition, "all" data should be contained as simply as possible – but presented in a clear and structured way. With List & Label such multifunctional reports can be easily realized. Interactive elements allow a single report to cover several scenarios, while selection options further enhance the report. This makes reports more comprehensive and informative and can be easily operated by the user.

Create Functional Dashboards in Seven Easy Steps

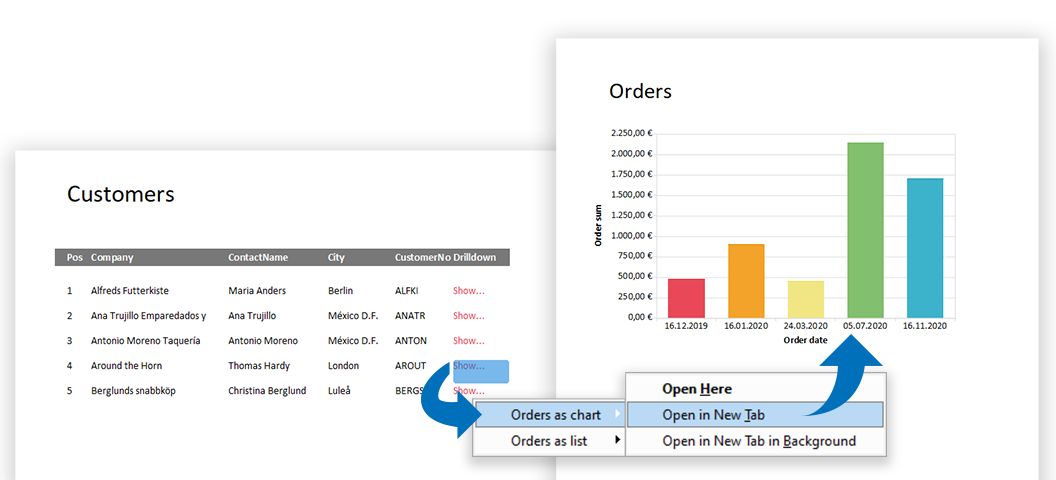
Complex data is usually processed visually in dashboards in order to be able to capture trends, outliers or up-to-date data at a glance. The design of dashboards depends on important details. These details make the difference between whether the information is interesting for the target group and whether conclusions can be drawn from it or not. For example, a bar chart is better to capture than to work your way through hundreds of table entries. Dashboards are often used incorrectly and are hopelessly overloaded with numerous different charts and gauges, such as traffic lights, speedometers and hardly readable tables.

Vastly Improved Chart Rendering in the Browser

divided pie chart in LL23

Over the years, we kept improving our chart engine with each version. We’ve added Donut, Radar and Treemap charts and offered new layout options. However, if your charts were to be rendered in the browser, the only available formats so far have been PNG or JPEG, leaving you with exactly two options: either have great quality and huge file sizes or a swift download and poor rendering quality. There was no option to combine both (and I’m not thinking “huge download and poor quality” here ). In LL24, this is going to change.