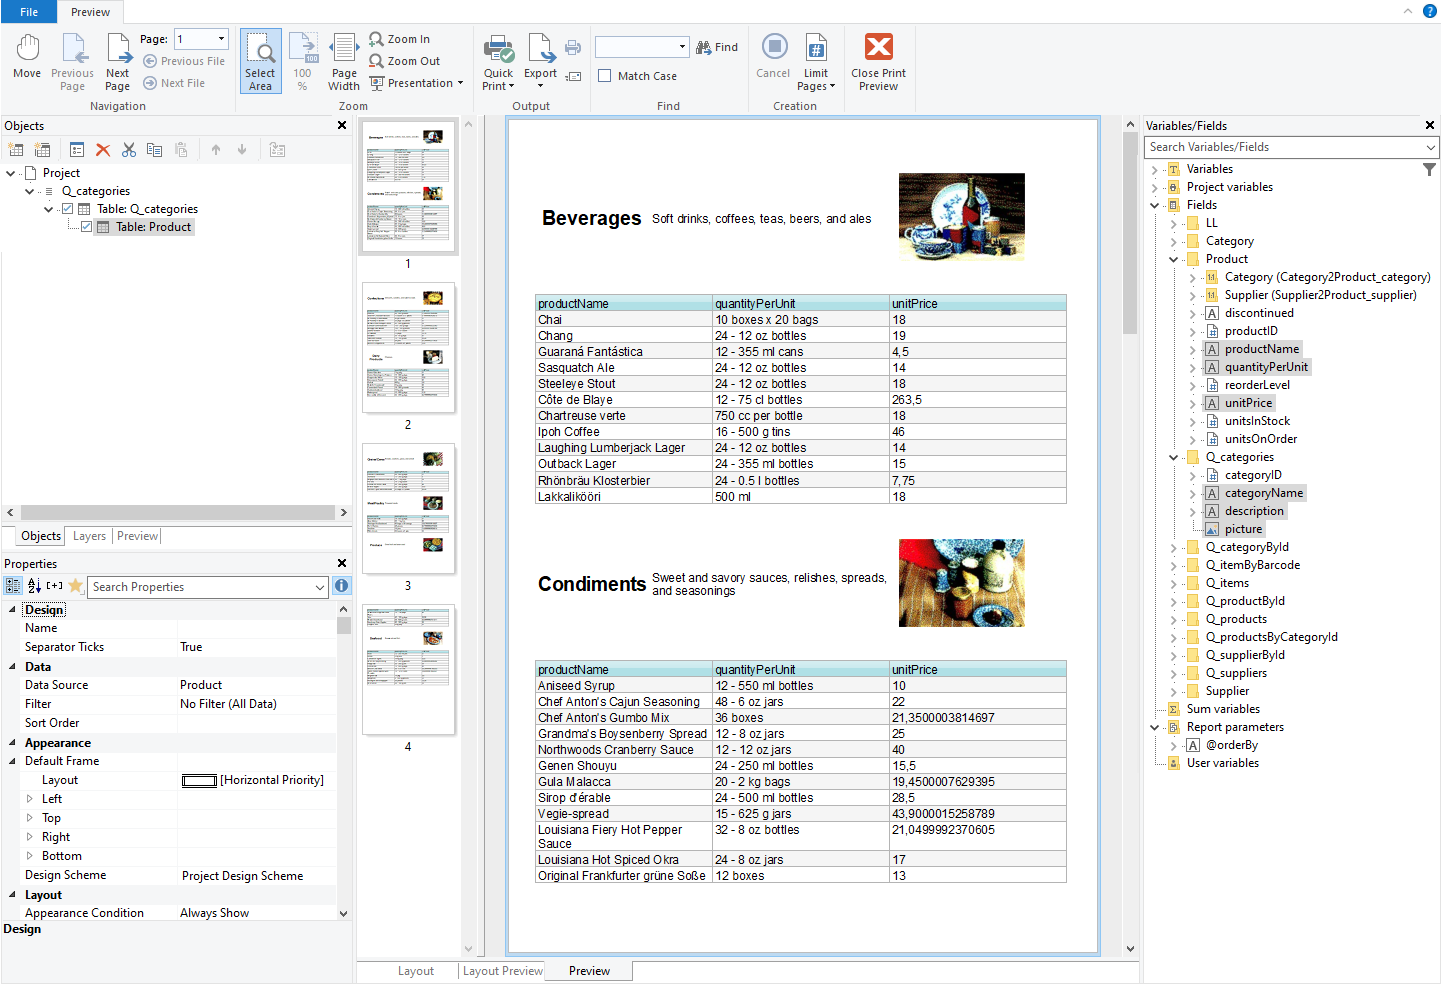
Text Selection and Copy to Clipboard for the Preview
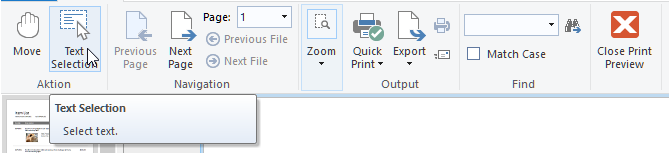
Creating preview files is all well and good. However, when you needed to access the texts within the preview for post processing, you had to resort to a text export, finding the relevant strings and copying them from there. In LL25, we added a powerful way to extract texts from a preview, directly from within the preview window.