List & Label Reporting Blog
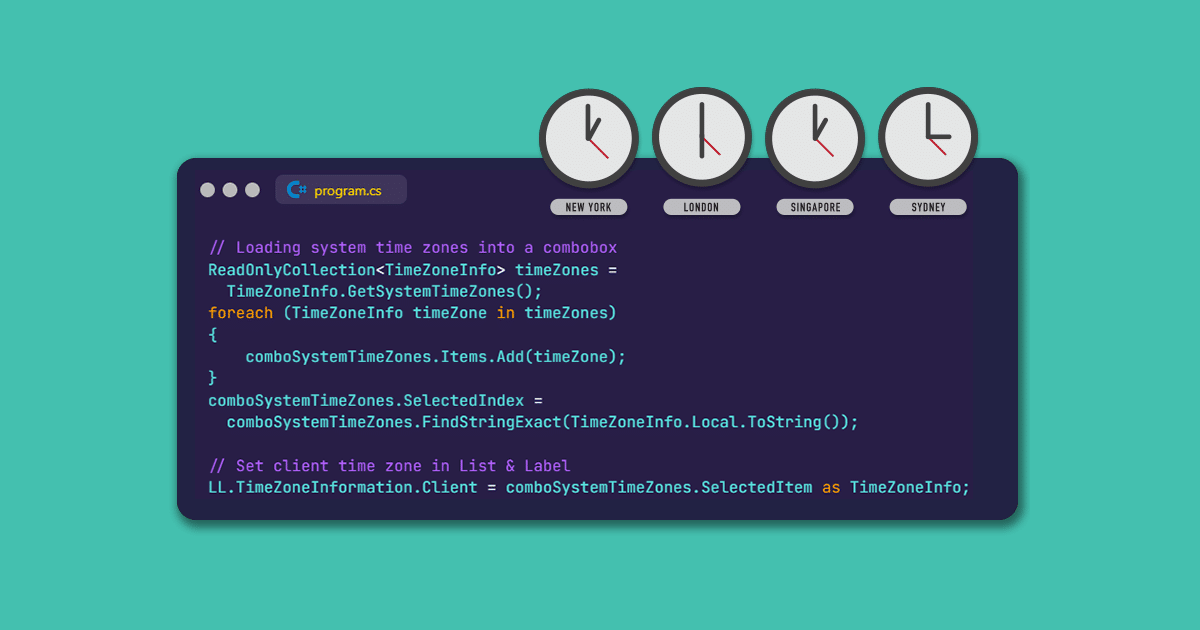
New time zone function in List & Label: solutions for complex reporting requirements
In the world of server-based reporting, there are often challenges in connection with different time zones. The complexity increases in particular when the database server, the … Read more

Using Your Own .NET Designer Objects in Unmanaged Code – Designer Object Bridge
Many things can often be implemented significantly easier and faster in managed code than in unmanaged code, such as with Delphi or C++. Sometimes, there already exist ready-made .NET modules which contain the desired requirements and which need to be used in your own unmanaged application. But the question then is: How can a .NET module be made accessible to an unmanaged system?
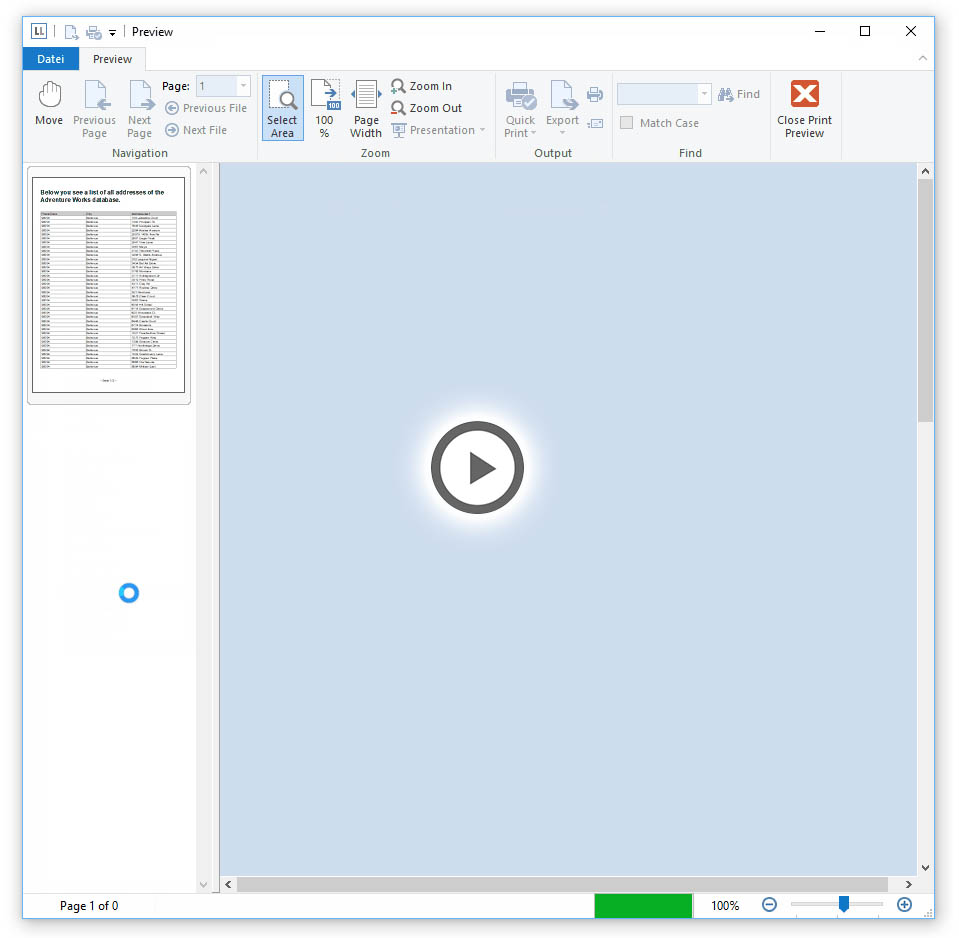
Unbelievable Printing Performance Boost
Continuing the journey of improving the performance, we decided to tweak a bit on the printing side as well. These optimizations help when using the same table several times with different fields. Think of a tabular report with some charts and a crosstab. Typically you have different views on your data in these objects. For these cases, the improvement is huge – I mean really huge.
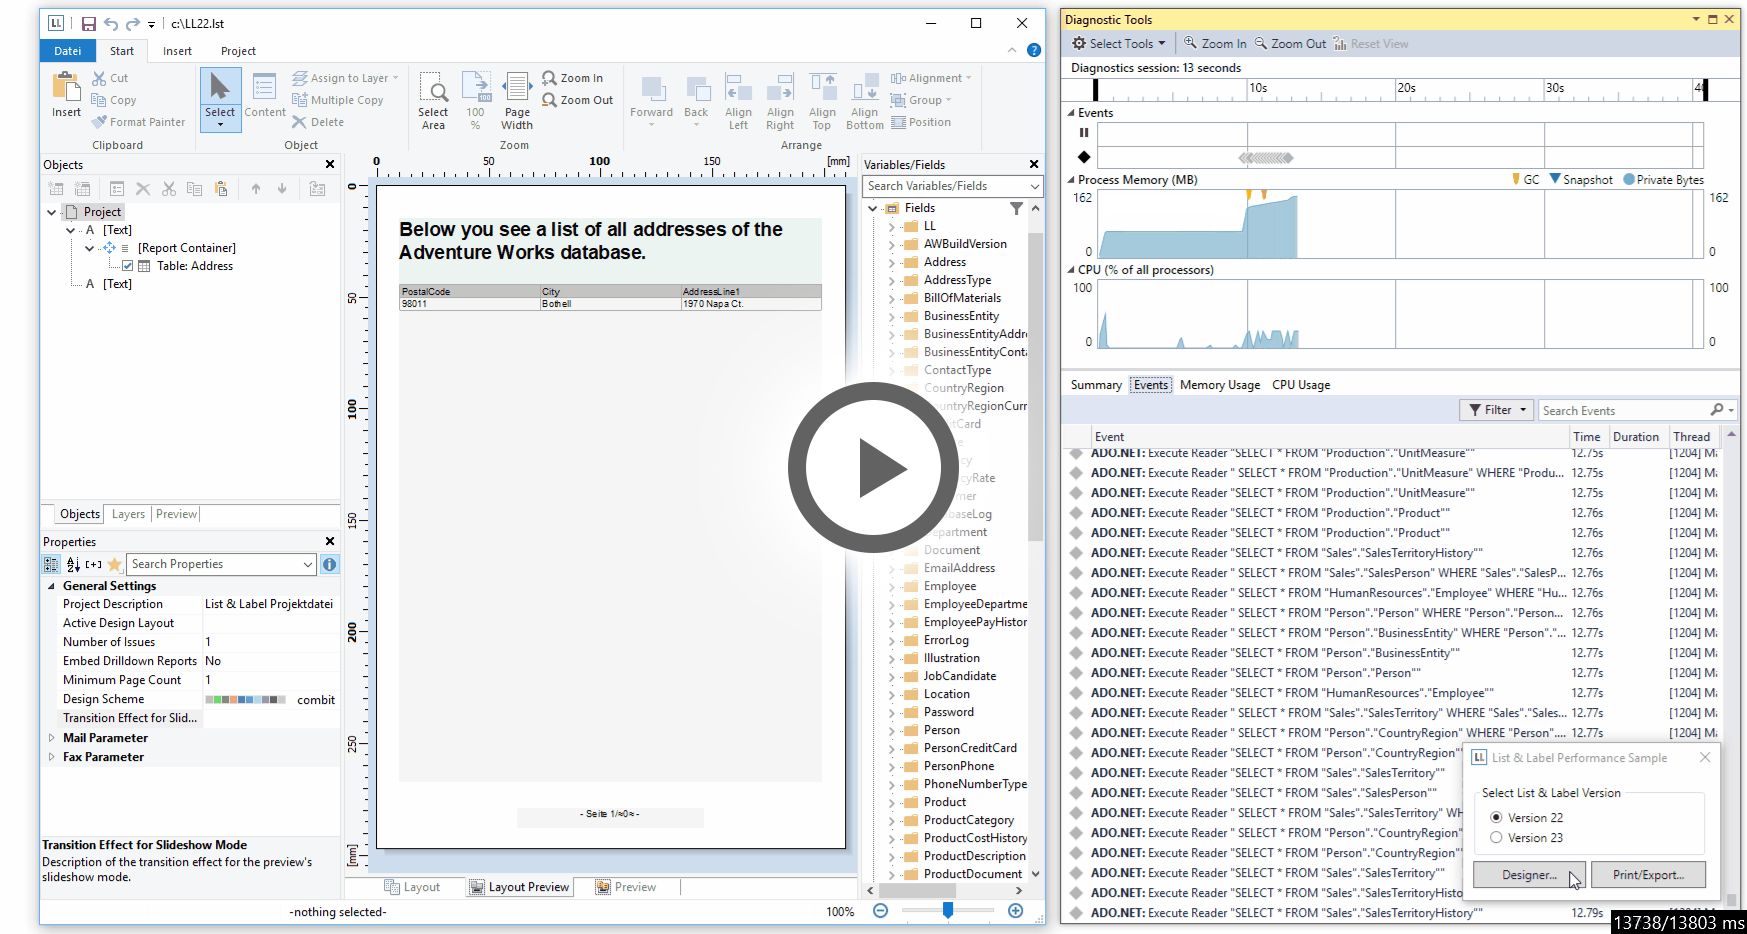
Huge Designer Speed-Up for Large Databases
Historically, List & Label has always been working without a database in the background. During the years, we've added powerful databinding to the components, however at the core, the principle stayed the same: your application (or the databinding layer) passes all available data before opening the Designer.
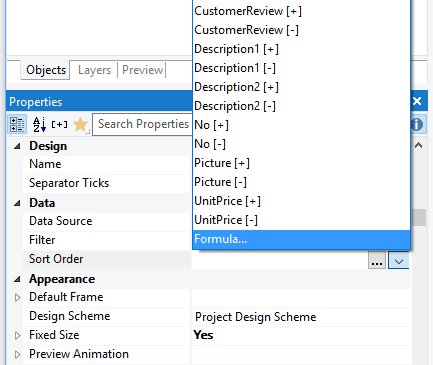
New Designer Features and Flexible Sorting
Today, I’d like to outline a few more minor new features of LL22 before they get lost in the upcoming blog posts on LL23. There are still plenty of nifty things in LL22 to discover that I haven’t blogged about yet.
Our TTFHW is Just 30 Seconds!
Have you ever stumbled across TTFHW? This is an important nerd metric, meaning "time to first hello world". Basically it tells you how long it will take you as a developer to get to your first hello world success using a platform / API.
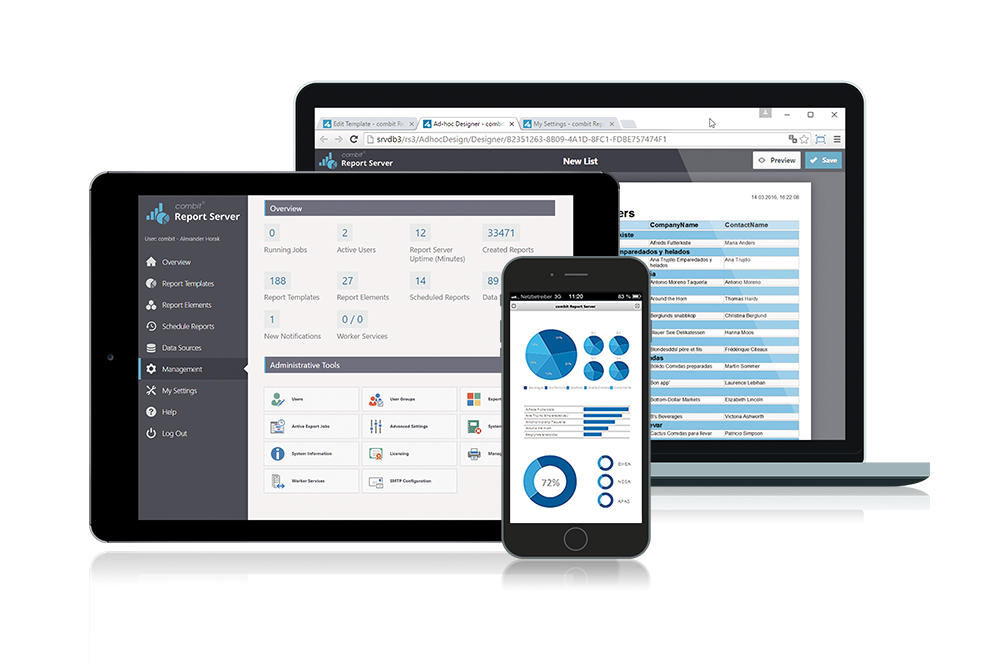
Report Server Soon Included in Enterprise Edition
This is a major, bold new addition that will be available with List & Label 23. Currently the combit Report Server is available as a standalone out-of-the-box, self-service reporting solution. You can configure data sources, ad-hoc-design your reports, preview in your browser, export reports to a huge variety of formats or schedule email blasts. All of this in a responsive web application that works on any device. Starting with version 23, this server product will be included in the List & Label Enterprise Edition.
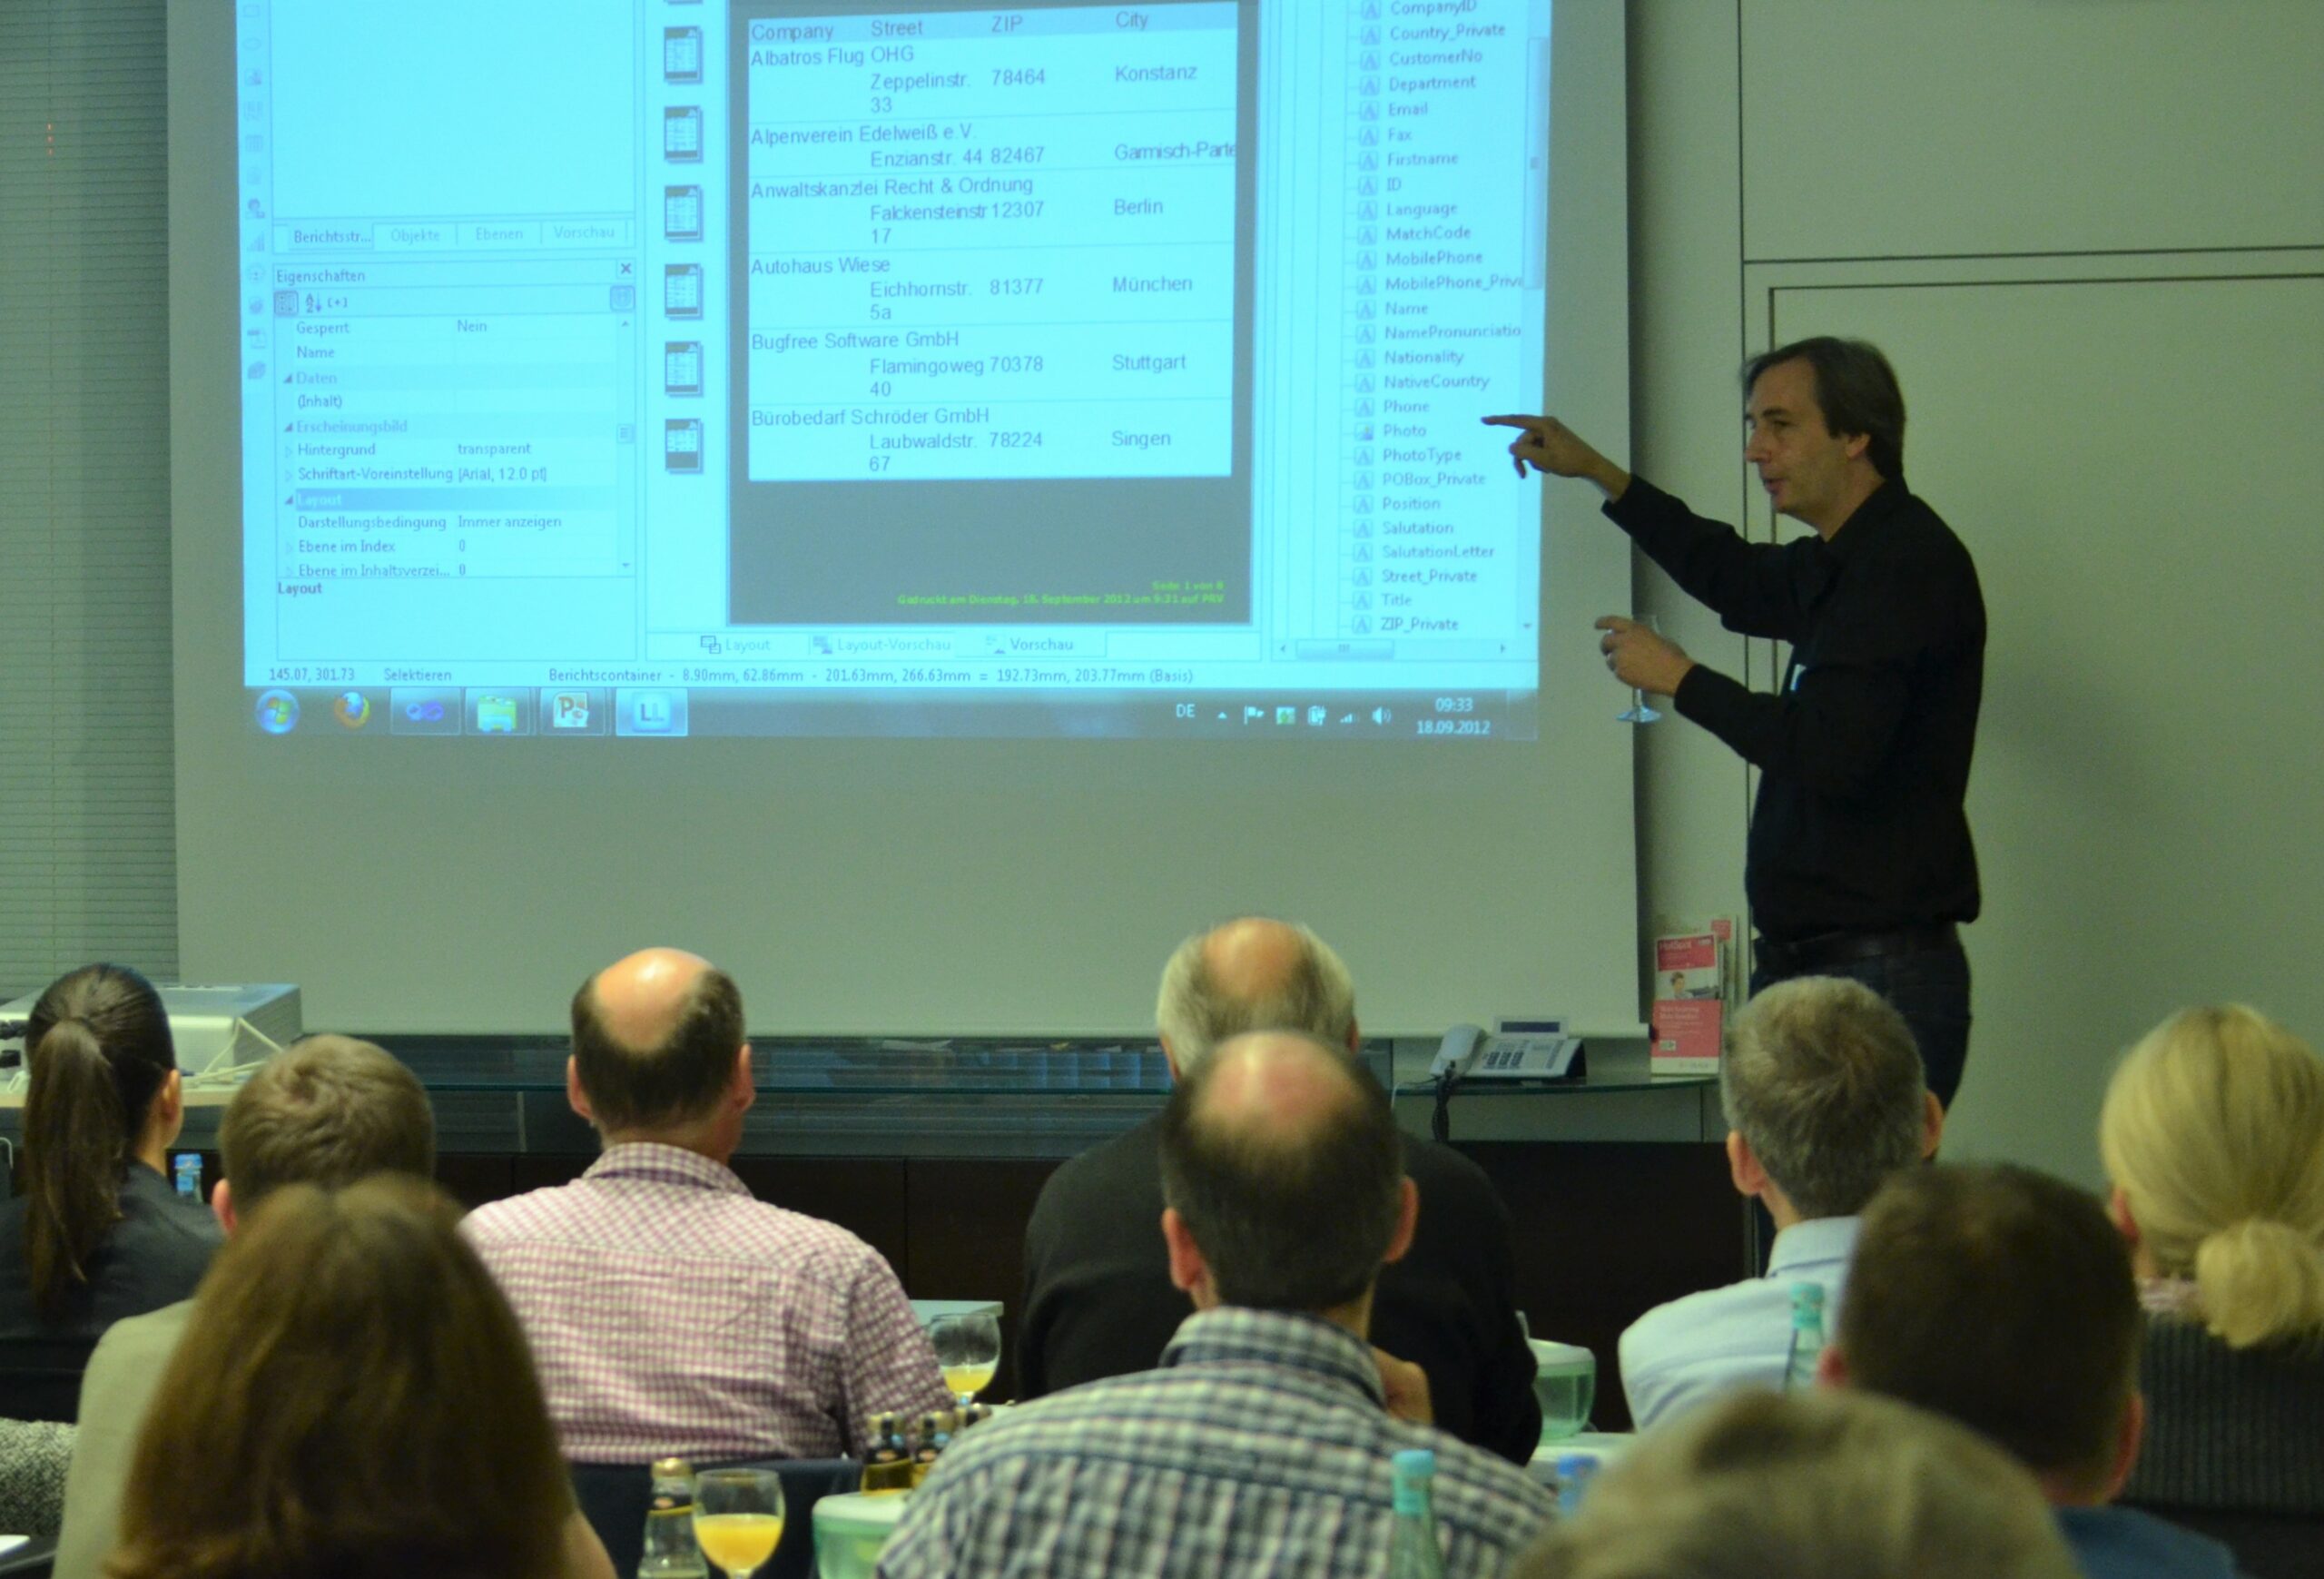
Six Hints for Developer Presentations
One of the nice parts of my job is getting around quite often. Through the years, I've held some hundred presentations. At developer conferences, user group meetings and our own roadshows (the next will happen this fall). I thought I'll share some hints and tools I've found valuable.

combit’s Visual Studio Love Story
Today marks the launch of Microsoft Visual Studio 2017. We're also celebrating 15 years of .NET and 20 years of Visual Studio. It's been a long way! Actually, I had the honor to attend the VS Live in San Francisco when .NET was released.
Simplified Xbase++ Reporting Tool Integration
Years ago I started developing a class to simplify the integration of List & Label into Xbase++ which I used for all my client's apps. The range of functionality grew with every new task. By now it supports real data preview which is handled in a separate thread.
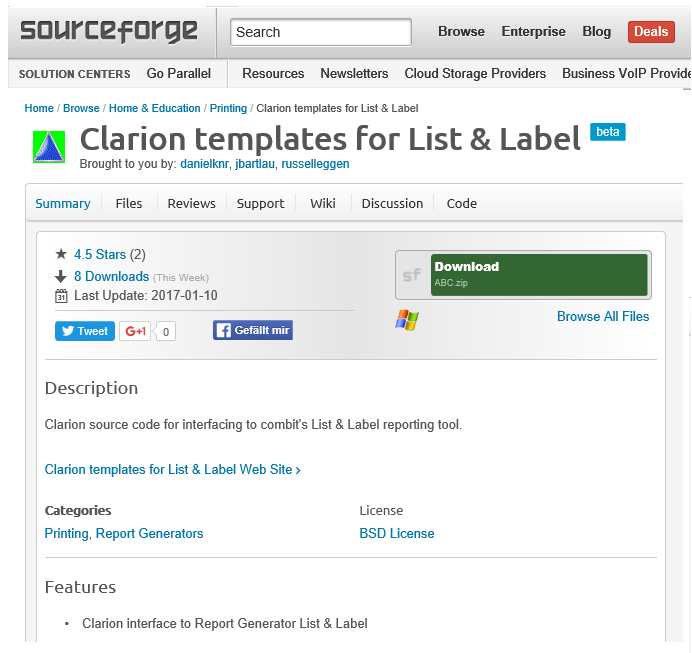
Ready for Takeoff: Clarion Template for LL22
The Clarion community has been working with List & Label for many years now. Starting with the Solace templates, those were donated to the public domain in 2010. Since then, various contributors have been working on them.


