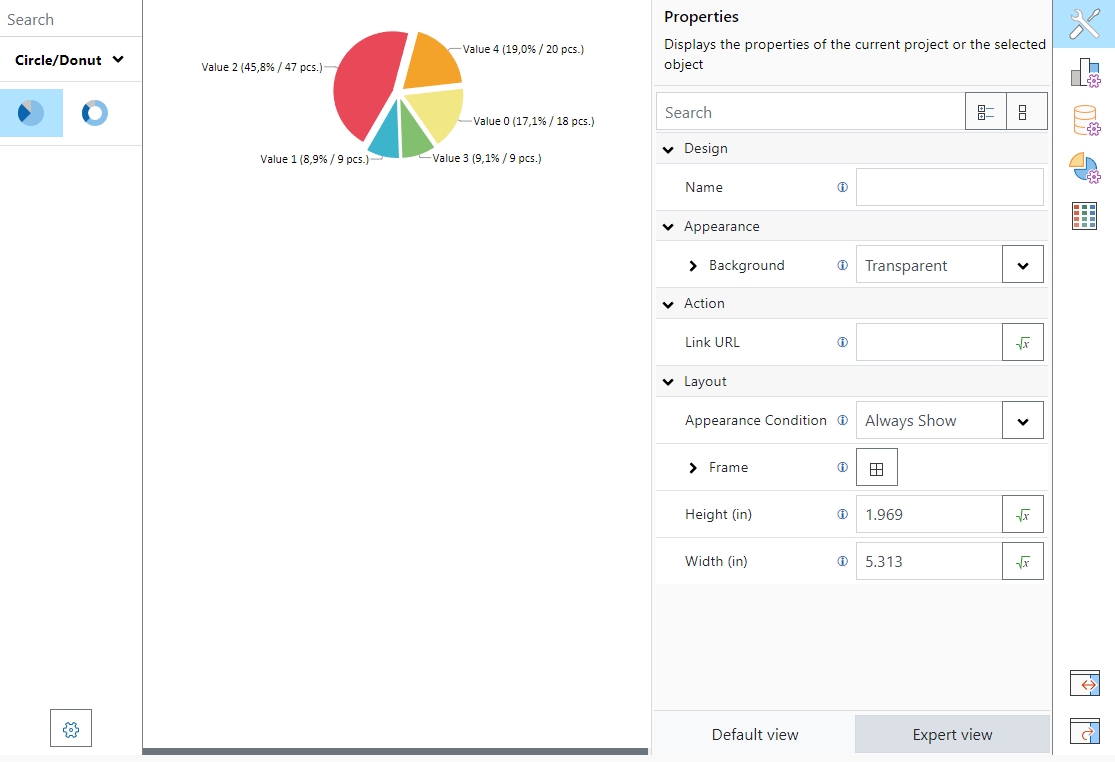
Enhanced Drag & Drop Support in the Designer
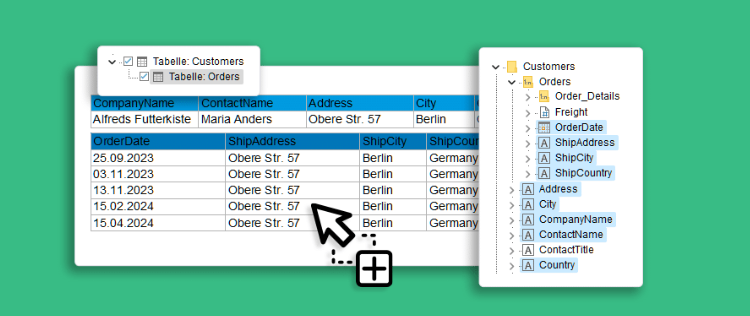
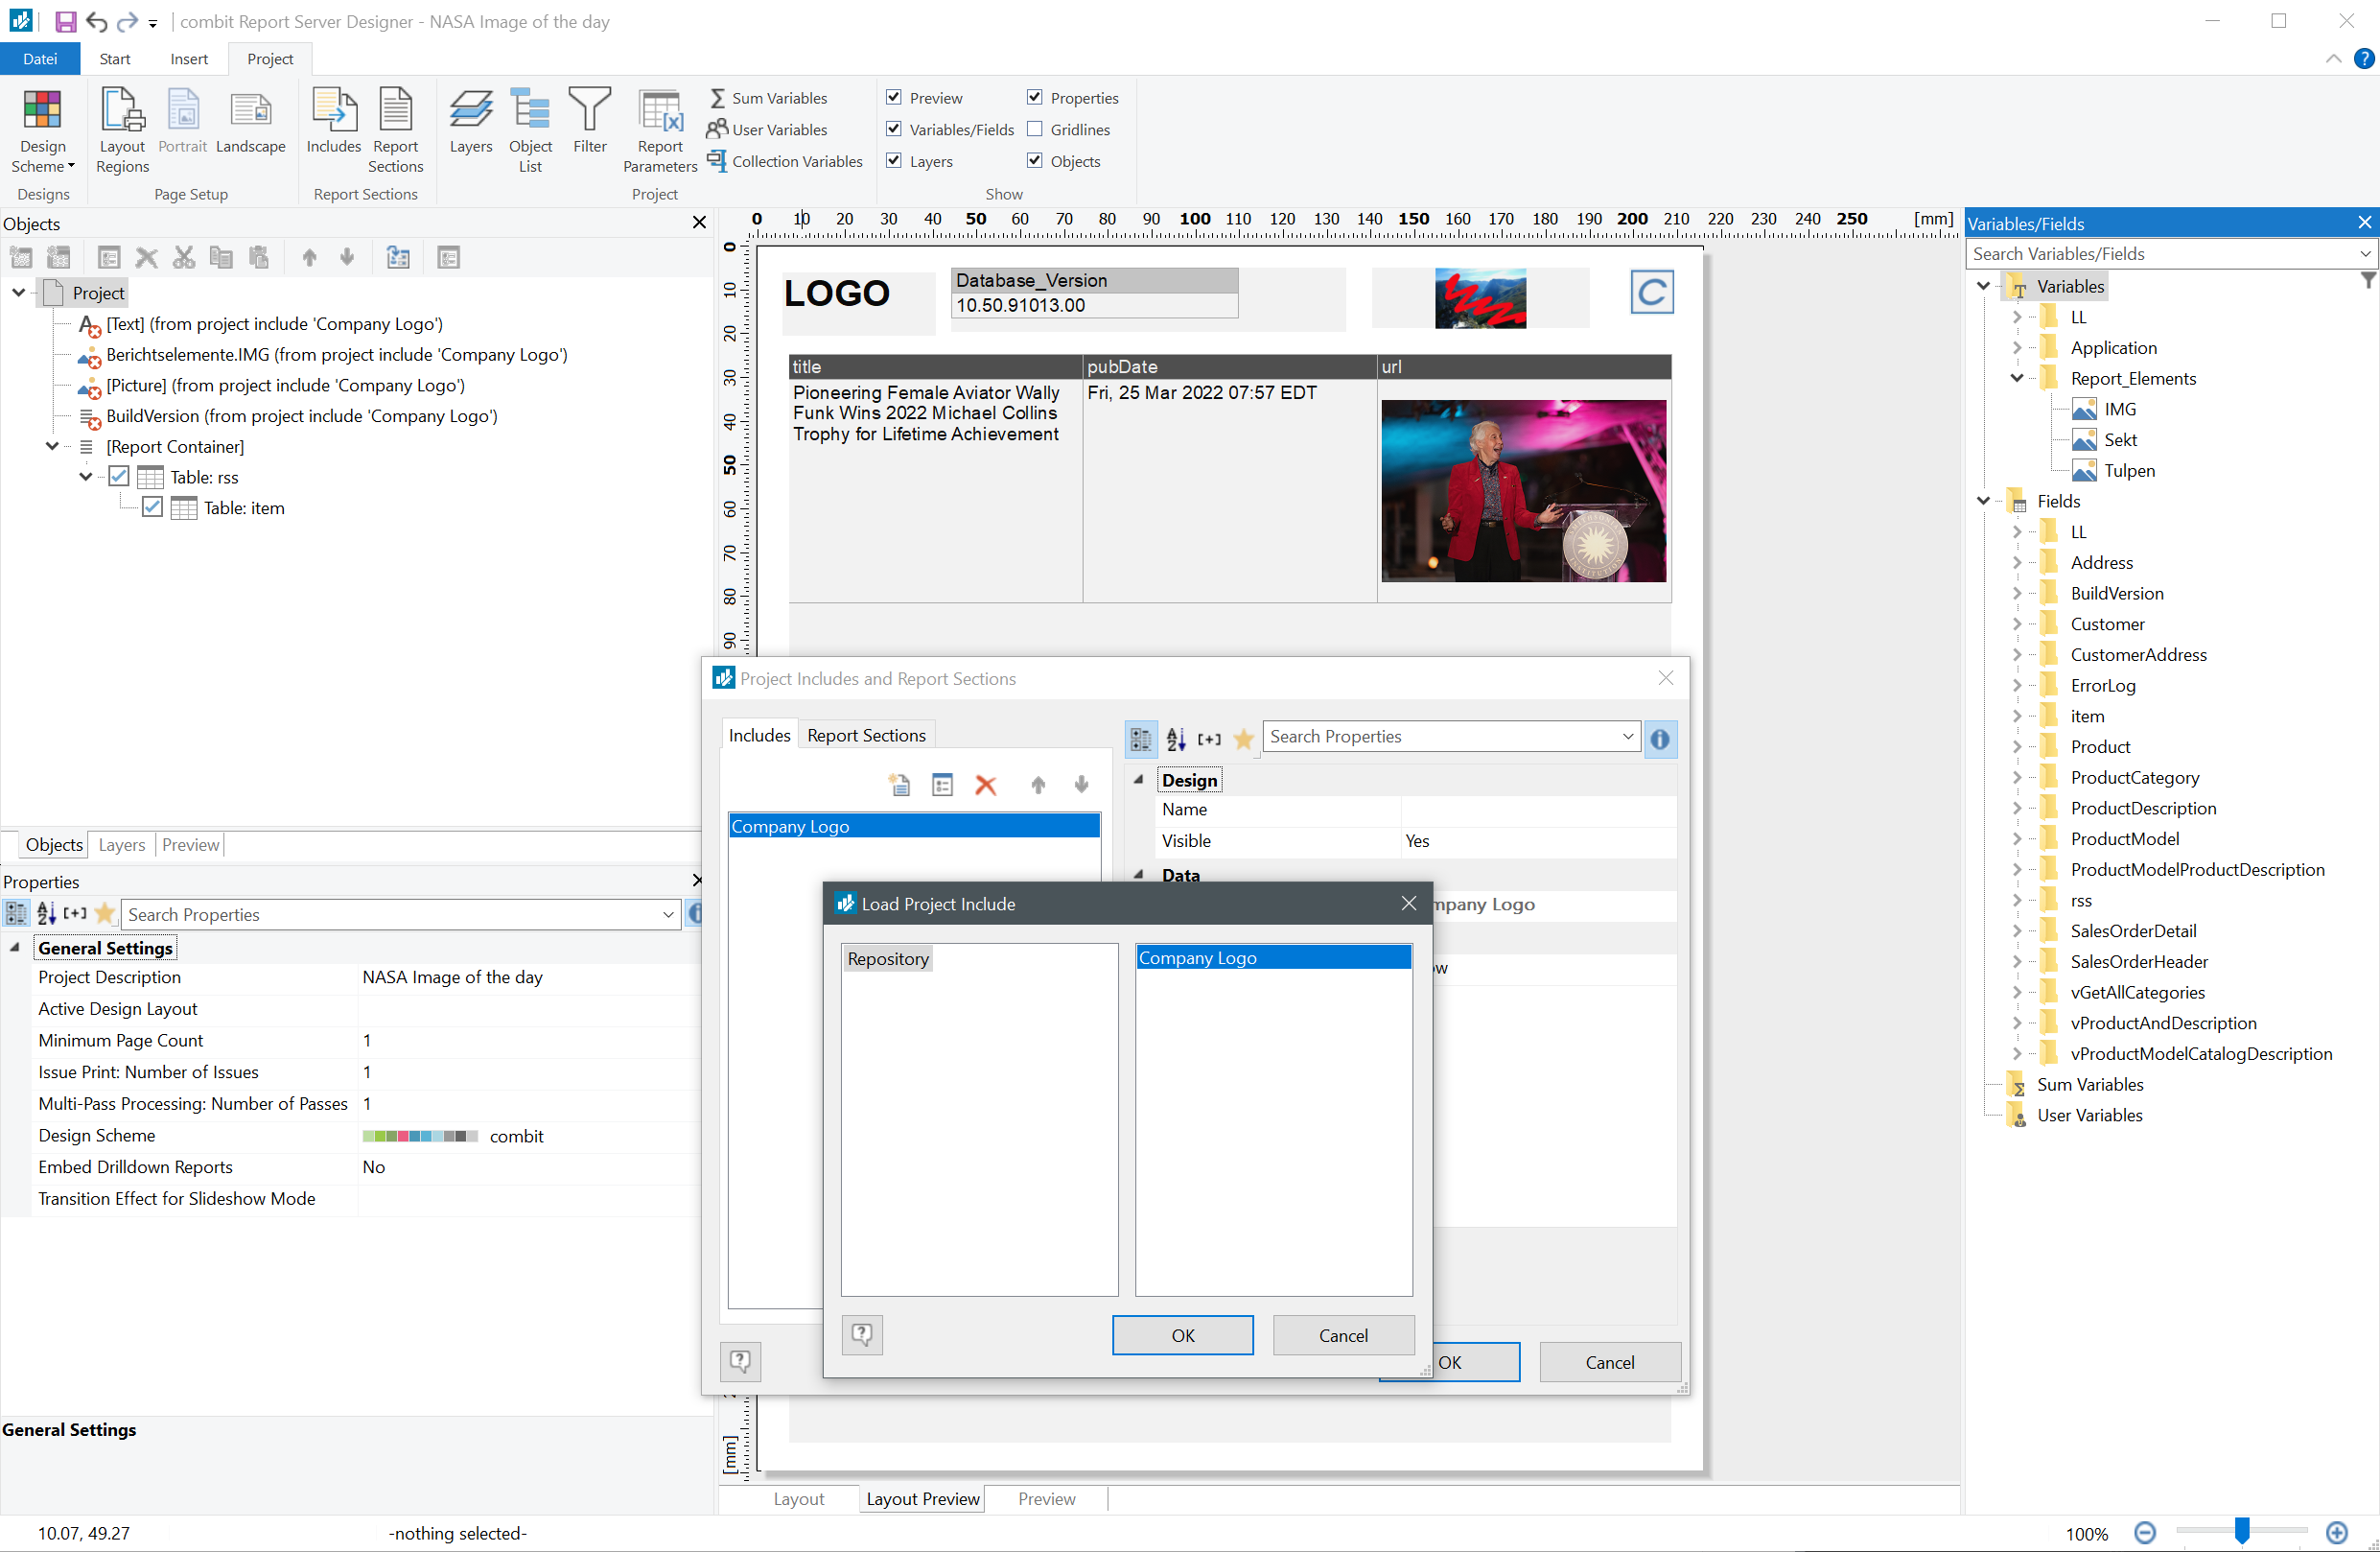
A frequently asked question was: “Why can’t I see the relations in the report designer?” This question refers to the variable/field window, in which 1:1 relationships were displayed, but not (the usually much more important) 1:n relationships. In short, our answer was always: “The relations are there, but only in the object window, e.g. when creating tables”. We even put the long answer in a Knowledgebase article.