Stop outgrowing your .NET reporting: How to avoid “We have to rewrite this”
Key takeaways Table of contents How “just PDF and Excel” turns into a rewrite Most .NET teams don’t plan to build an enterprise-grade reporting platform. … Read more
Since version 30, the Web Report Designer supports drilldowns. This allows you to implement interactive reports entirely in the browser – including navigation between different detail levels. This feature was previously only available in the desktop designer.
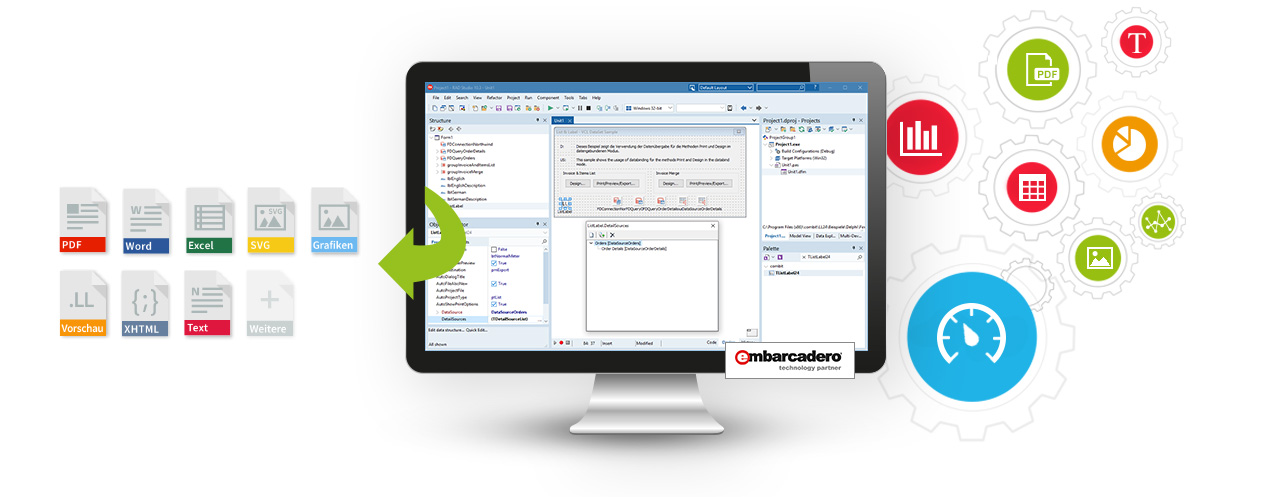
List & Label is a reporting component that integrates with applications to provide them with rich reporting capabilities. It allows developers to create sophisticated reports based on data from any source. Easy data binding for your own VCL applications is provided by List & Label’s FireDAC component, which supports numerous data sources such as Oracle, MS SQL Server, SQLite, DB2, MySQL and PostgreSQL, as well as many other databases and formats. The control over the data for reporting always remains with the application itself.
List & Label’s most recent version 29 is coming along with quite a fe exciting news for the Web Report Designer and the Web Report Viewer. These updates provide improved functionalities and enhanced usability to developers and end users alike.
Up until version 27, you were able to use the HTML5 Viewer in your own .NET web applications in order to display a report preview directly in the browser. Interactive user actions such as drill down, filtering data using report parameters and much more were already possible. But the technology that was utilized for this is getting older now, as for example the jQuery framework. With the new Web Report Viewer, we have created a modern, highly compatible replacement, which has been available since version 27 (year 2021).
In this summary you will find the most important new features and improvements in Service Pack 27.003. The individual entries were taken directly from the English Readme. A detailed list of all changes can be found in the ServicePack.pdf in your installation as well as in the Service Pack download section.
We love Java! List & Label itself has a native C++ API. This API can also be called directly from Java applications via a Java Native Interface Wrapper, which has already been part of the product for ten versions. Over the years, we have implemented many suggestions from the community, for example we have improved the callback interface of the JNI component. Now we are going one step further – do you want to help us to improve the JNI wrapper, too?
Today, modern reports must be designed for more than just one purpose. In addition, "all" data should be contained as simply as possible – but presented in a clear and structured way. With List & Label such multifunctional reports can be easily realized. Interactive elements allow a single report to cover several scenarios, while selection options further enhance the report. This makes reports more comprehensive and informative and can be easily operated by the user.
Complex data is usually processed visually in dashboards in order to be able to capture trends, outliers or up-to-date data at a glance. The design of dashboards depends on important details. These details make the difference between whether the information is interesting for the target group and whether conclusions can be drawn from it or not. For example, a bar chart is better to capture than to work your way through hundreds of table entries. Dashboards are often used incorrectly and are hopelessly overloaded with numerous different charts and gauges, such as traffic lights, speedometers and hardly readable tables.
It’s been a while since the original announcement back in June 2016, but hey, we’re finally there. Today marks the release of a brand new VCL component that uses the data provider interface and FireDAC at its core.