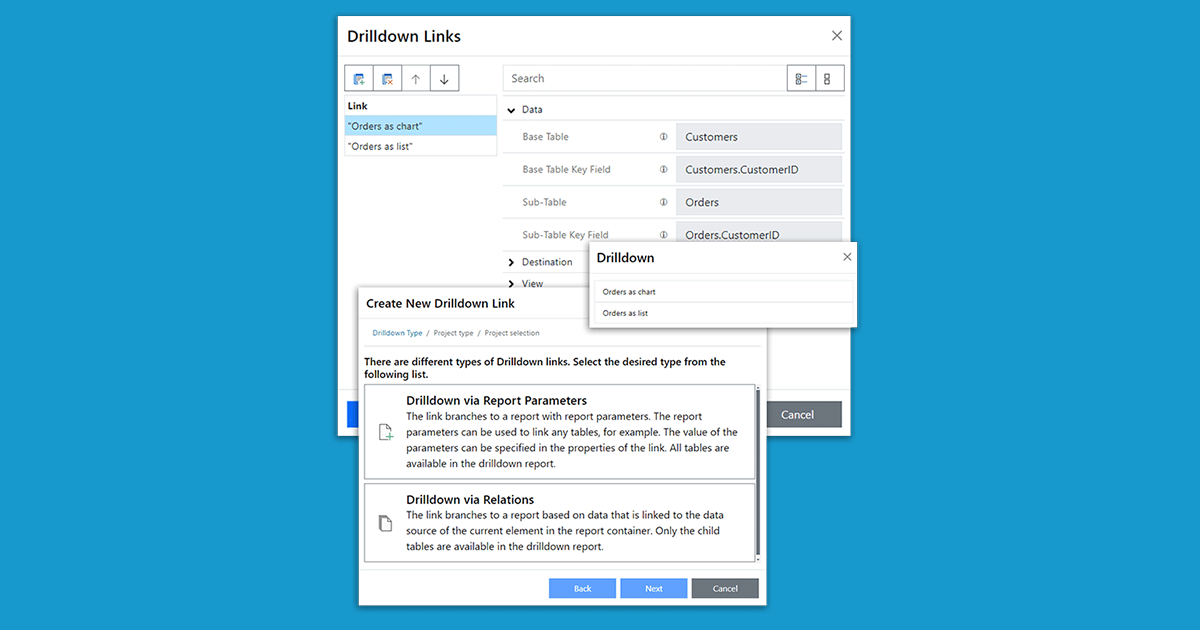
Stop outgrowing your .NET reporting: How to avoid “We have to rewrite this”
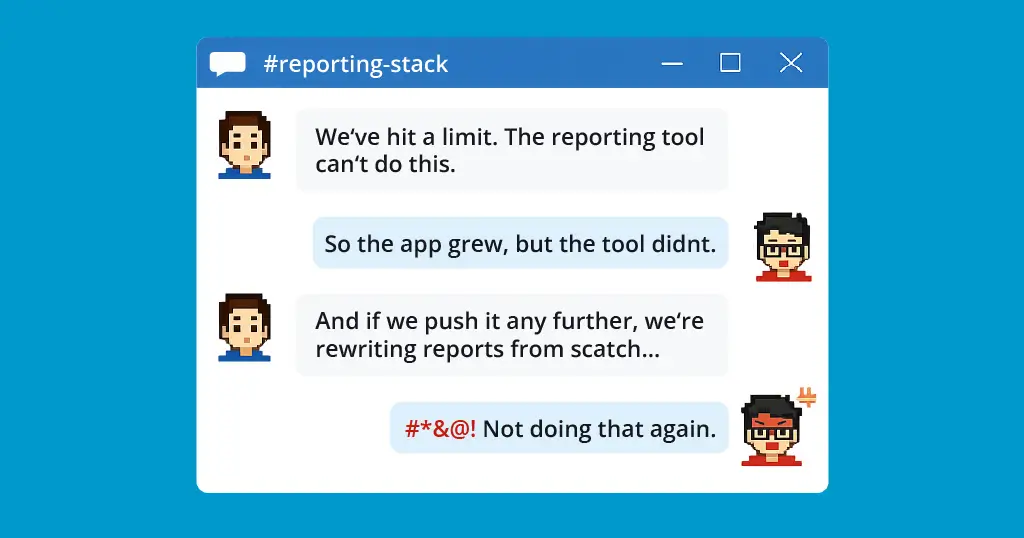
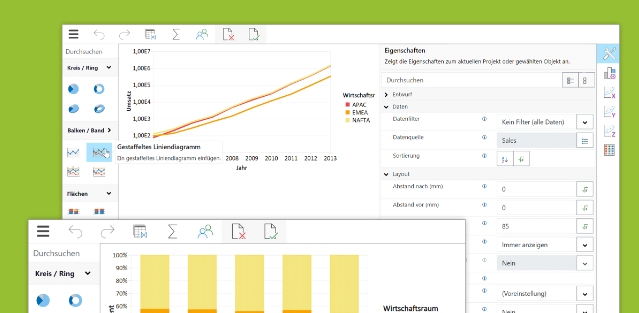
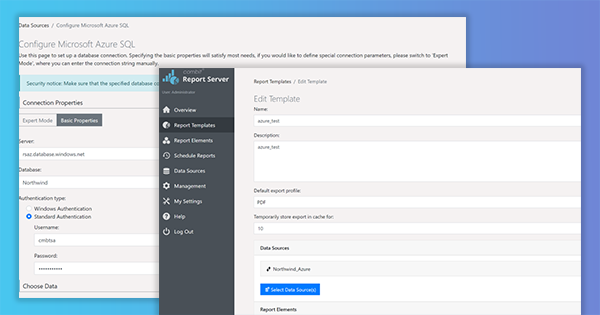
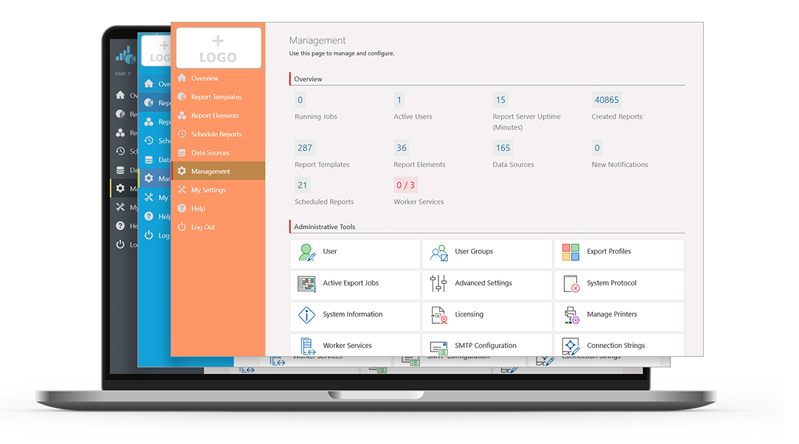
Key takeaways Table of contents How “just PDF and Excel” turns into a rewrite Most .NET teams don’t plan to build an enterprise-grade reporting platform. … Read more
Since version 30, the Web Report Designer supports drilldowns. This allows you to implement interactive reports entirely in the browser – including navigation between different detail levels. This feature was previously only available in the desktop designer.
List & Label’s most recent version 29 is coming along with quite a fe exciting news for the Web Report Designer and the Web Report Viewer. These updates provide improved functionalities and enhanced usability to developers and end users alike.
As we keep getting requests to support calling List & Label from an Azure Function, and – due to several restrictions like e.g. GDI sandboxing – List & Label can’t be used directly in this context, I thought it might be interesting to explore another way to the cloud, this time using the Report Server. Using its REST-API, you can even create reports from an Azure Function. But let’s walk through the process step by step.
In the Report Server’s most current version, a few more exciting new features have been implemented, as a response to some customer requests. Overall, the new Report Server now visually integrates better into your application. Also, in addition to new actions for planned reports, it also offers additional enhancements for Excel export. Service Pack 27.001 will provide customers with a completely new preview.
In our last blog post, we already announced it: this time, we’d like to address further challenges we encountered during our development of the Web Report Designer. Take advantage from what we learned, and maybe even use some bits for your own projects.
The second Service Pack for List & Label 26 has been released and contains many new features and improvements. We have listed them all for you in this blogpost. The individual entries were taken directly from the English Readme.
Today, modern reports must be designed for more than just one purpose. In addition, "all" data should be contained as simply as possible – but presented in a clear and structured way. With List & Label such multifunctional reports can be easily realized. Interactive elements allow a single report to cover several scenarios, while selection options further enhance the report. This makes reports more comprehensive and informative and can be easily operated by the user.
Have you ever wanted to migrate your List & Label projects and data providers to a central webserver to export and view them on an Android or iOS tablet with just a few lines of code? With the upconing new version 23 we have some good news for you!