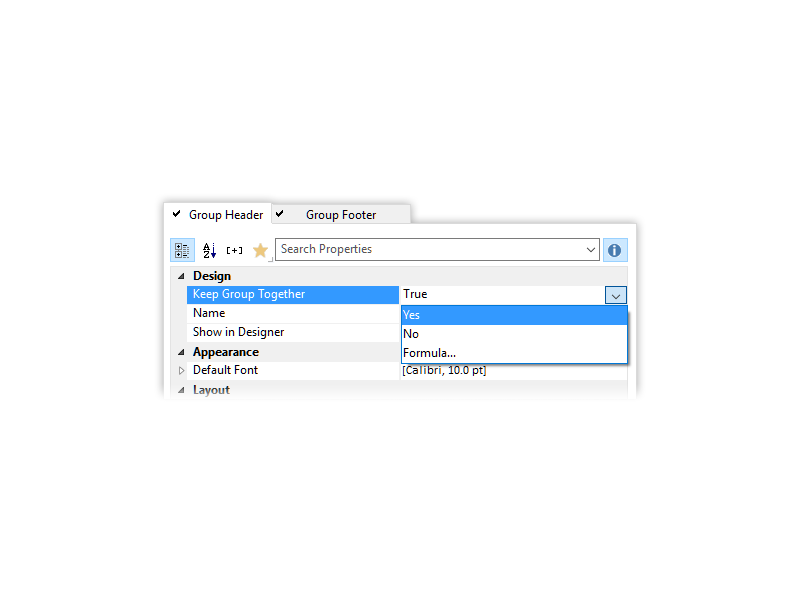
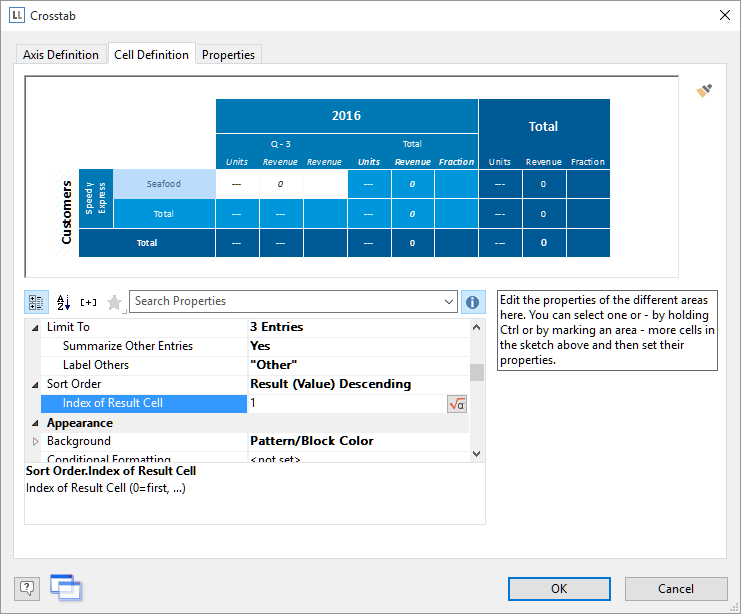
Select Your Property Favorites
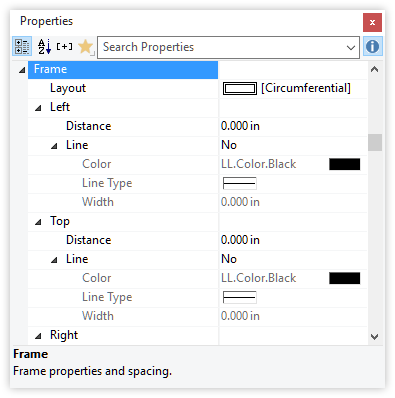
This is one of the major UI visible changes in LL22. All objects have their distinct set of properties which is displayed in the property window. Depending on the complexity and flexibility of the object, the list of properties is quite long where most of the time you probably don't need 50% of them. Enter the new Property Favorites.