Powerful, Reusable Subreports for Your Reports

Often reports consist of similar, repetitive sections like a number of charts or crosstabs just filtered for different categories but otherwise identical. Or tables and subtables that have a preselected set of columns you want to have wherever this table is used. List & Label 26 now helps you and your users to get rid of the tedious task to maintain such reports and apply changes to all instances of objects. You can add real subreports that contain exactly the required items and maintain those in one single place.

Interactive Reports with List & Label

Today, modern reports must be designed for more than just one purpose. In addition, "all" data should be contained as simply as possible – but presented in a clear and structured way. With List & Label such multifunctional reports can be easily realized. Interactive elements allow a single report to cover several scenarios, while selection options further enhance the report. This makes reports more comprehensive and informative and can be easily operated by the user.

Create Functional Dashboards in Seven Easy Steps

Complex data is usually processed visually in dashboards in order to be able to capture trends, outliers or up-to-date data at a glance. The design of dashboards depends on important details. These details make the difference between whether the information is interesting for the target group and whether conclusions can be drawn from it or not. For example, a bar chart is better to capture than to work your way through hundreds of table entries. Dashboards are often used incorrectly and are hopelessly overloaded with numerous different charts and gauges, such as traffic lights, speedometers and hardly readable tables.

How to Automatically Export Reports to Cloud Storage Services

With List & Label you can export reports in different formats like PDF, Word, Excel and many more. The resulting reports can either be stored directly in the file system or – in .NET – in a stream, in order to transfer them manually into a database, a document management system or similar. Reports can also be automatically stored directly in so-called cloud storage services. The cloud storage providers for GoogleDrive, Microsoft OneDrive or Dropbox are available in List & Label for .NET for this purpose.

New Connection to Microsoft Flow for the Report Server

Microsoft Flow allows you to define your own processes and workflows based on various triggers. More than 200 services such as Office 365, Facebook, WordPress etc. are available for this purpose, which can interact with each other in the workflows (called flows). These services offer actions as well as triggers, such as when a file is created (on Google Drive, DropBox or also on alternative services like e.g. box) or when a mail is received. Each flow has a trigger and may have multiple actions. This article describes how to connect combit Report Server to Microsoft Flow.

New Apps for the combit Report Server

ios app combit report server

This post belongs to a series of blog posts that are dedicated to the innovations of combit Report Server 24. At this point I would like to recommend the two posts “What’s New in Report Server 24, Part 1” and “What’s New in Report Server 24, Part 2“.

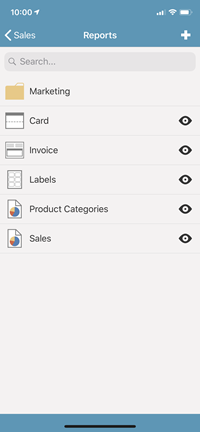
Today we are talking about the new native iOS and Android apps for the combit Report Server, which allow you to access the reports on your Report Server directly from your smartphone or tablet. Previously, this was also possible directly via the Report Server web interface, but the new apps offer additional options and a device adapted and fast operation, as you would expect from a native app.