List & Label Reporting Blog

New Service Pack 30.003 for List & Label und the Report Server
The latest service pack 30.003 for List & Label adds Windows 11 25H2 support, introduces a new datastructure tree component in the Web Report Designer, improves performance for large projects, and increases the maximum number of print passes to 1000.
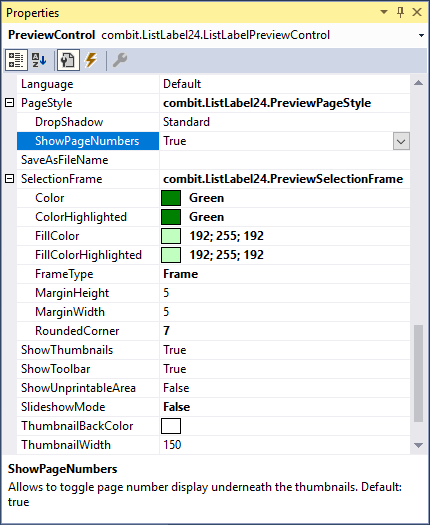
Customizing the Preview’s Look & Feel
Since the introduction of our feature portal three years ago, it has become an important driver for our innovation. If you filter for "available in latest version", you'll find some fourty features we've built into the product on your request. So here comes a big "thank you" to everyone participating! Your help, effort and ideas are more than welcome anytime. Of course, we've implemented some of the top voted demands into LL24. One of them has been to enable the customization of the preview window's look and feel.

Add Your Custom Objects and Functions to the Web Designer
Extensibility is a first class citizen in the List & Label universe. You can add your own functions and objects to the Designer, enabling complex calculations within your code or custom objects. However, there was one important link missing so far – all this code just runs on the desktop. If your application runs on a server and you're using the Web Designer you're hosed – until version 24.
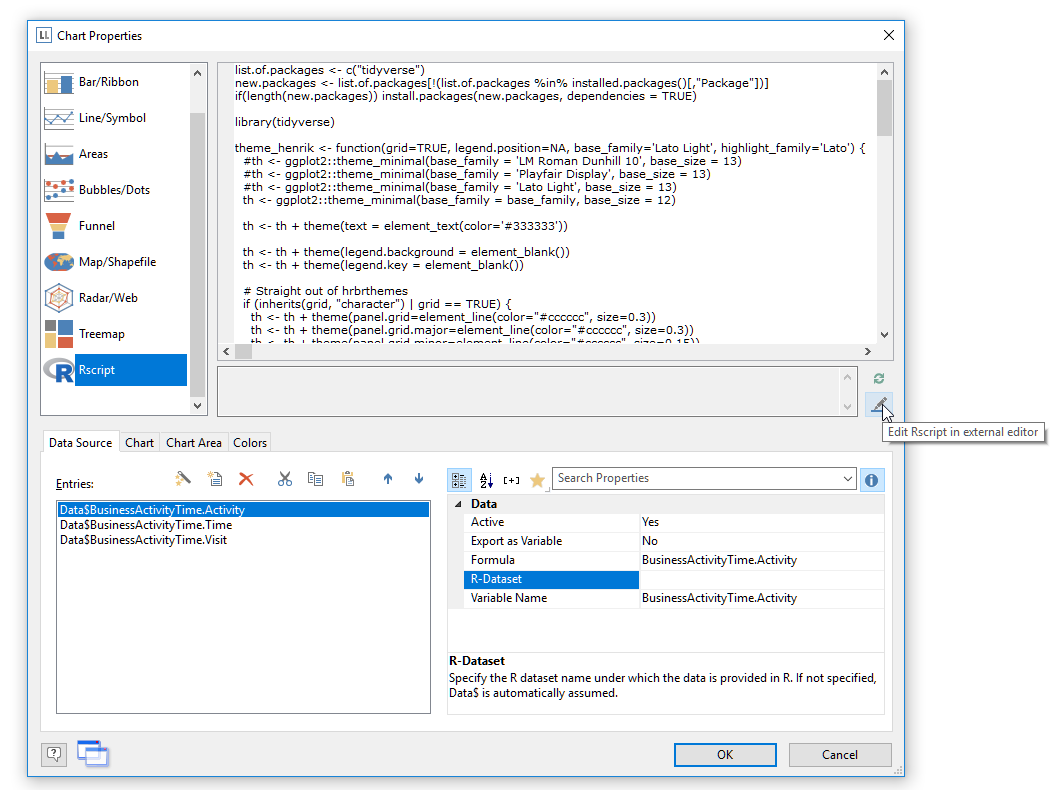
Use Rscript Visualizations for Your Reports
While List & Label’s charts offer a lot of visualization types and are extended almost every version, there are way too many visualization types to support them all. Thus, requests for new chart visualizations keep bubbling up in our feedback portal. On the other hand, Rscript is a well established language specialized for statistical computing and graphics that supports any visualization I can think of. So it absolutely makes sense to add Rscript output to the available chart visualization and include the best of both worlds – List & Label’s versatility for report layout and data access and Rscript’s deluge of visualization types. And that’s just what we did for the Enterprise Edition of List & Label 24.
Vastly Improved Chart Rendering in the Browser
Over the years, we kept improving our chart engine with each version. We’ve added Donut, Radar and Treemap charts and offered new layout options. However, if your charts were to be rendered in the browser, the only available formats so far have been PNG or JPEG, leaving you with exactly two options: either have great quality and huge file sizes or a swift download and poor rendering quality. There was no option to combine both (and I’m not thinking “huge download and poor quality” here ). In LL24, this is going to change.
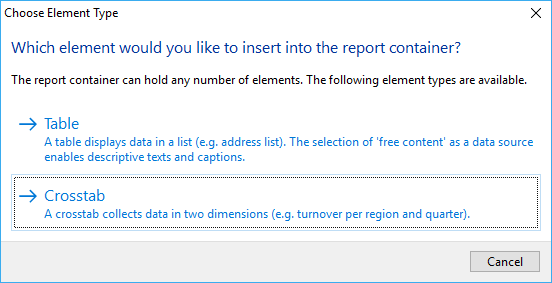
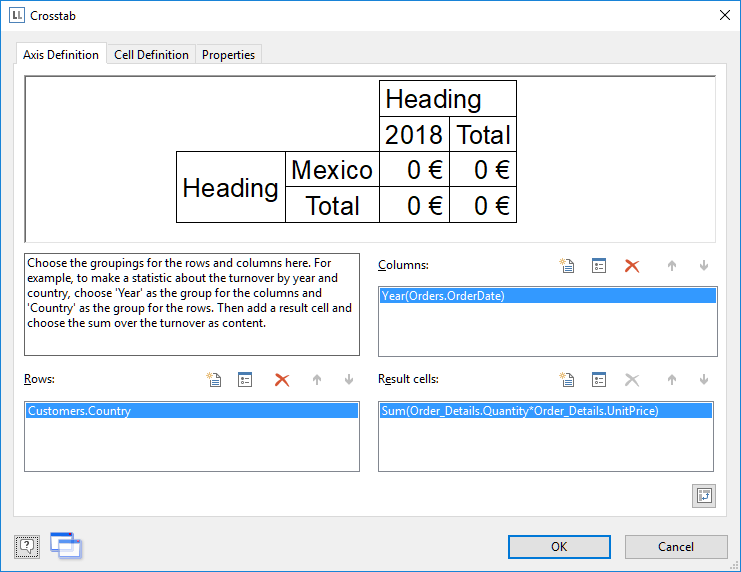
Creating Pivot/Crosstabs via Drag & Drop
A pivot/crosstab does a great job in aggregating your data and helps to spot trends and outliers. We’ve put great effort in enhancing our pivot/crosstab support for the last few versions. However, although there’s a nice wizard to get you started, usability testing showed that even creating simple pivot/crosstabs was still a challenging task for some users. That’s something we hope to change with LL24.
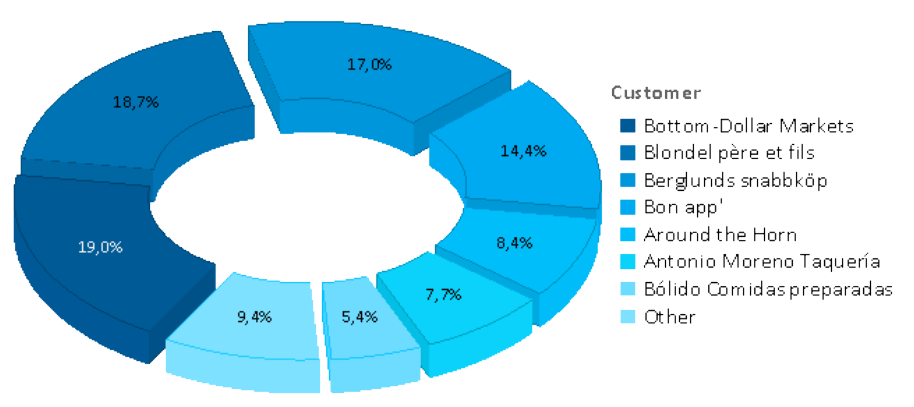
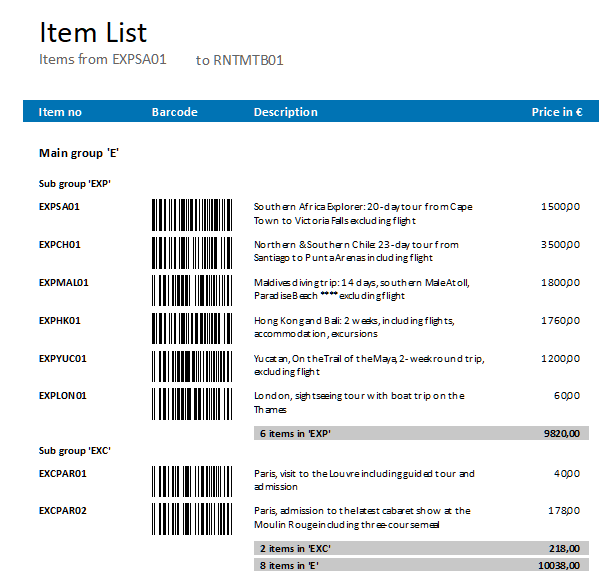
Converting Crosstabs to Charts and Vice Versa With List & Label
Crosstabs and charts have a lot in common. Often I find myself designing a crosstab for e.g. the sales per country. This works fine to get the absolute or even relative numbers. However, to get a visual impression of the fractions for a dashboard, I add a chart 99% of the time that shows just the same data as the crosstab.
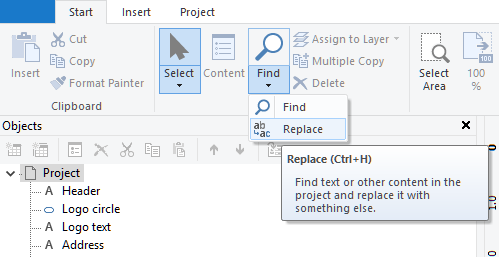
Easily Replacing Texts and Identifiers in the Designer
Continuing our quest for an improvement of the Designer’s refactoring features, it’s obvious that finding text alone is only halfway to quickly and easily refactoring your projects to accomodate them to changed field names, table names or other identifier changes. So we decided to take this project one step further and offer a powerful replace feature in LL24.
How to “Find” Things in the Designer
One of the most wanted features from our feature portal will finally be available in List & Label 24: a powerful find feature for the Designer.
Extending “Expandable Regions” to Groups
In Version 19, we introduced a new feature called "expandable regions". When activated on a top-level table, this will enable to dynamically collapse and expand the table's sub items in the preview and HTML5 viewer.
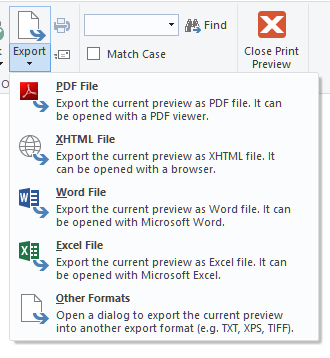
Export Files Directly From the Preview
So far, it hasn't been possible to export to all of our export formats from the preview window. The simple reason is that we're using the EMF file format internally while the exporters need completely different information that cannot be extracted from the EMF. Thus, we were only able to support image file formats and – of course – PDF, which is created from EMF vector information.


