List & Label Reporting Blog
Full Support for ZUGFeRD/Factur-X Starting with List & Label 31
With the release of version 31 of List & Label in October 2025, full support for the current ZUGFeRD/Factur-X standard 2.3 will be available.
The upcoming version 2.4 – already announced for Q4/2025 – will also be supported via service packs for List & Label 31.
This makes List & Label a future-proof solution for digital, legally compliant e-invoicing across Germany and Europe.
New GraphQL Data Provider for List & Label
GraphQL was publicly released in 2015 and became quite popular since then. It's used by a number of big web applications like Instagram, Facebook and others.
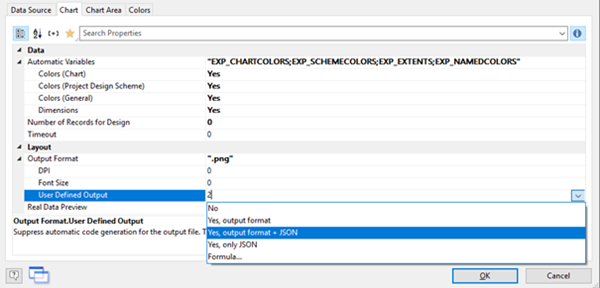
Pushing the Limits with Custom Output for Rscript
While for standard tasks the default mechanism for Rscript rendering of List & Label might be sufficient and convenient to automatically generate the png, jpeg or svg chart output from a Rscript on the fly, there might be situations where you simply desire more control.
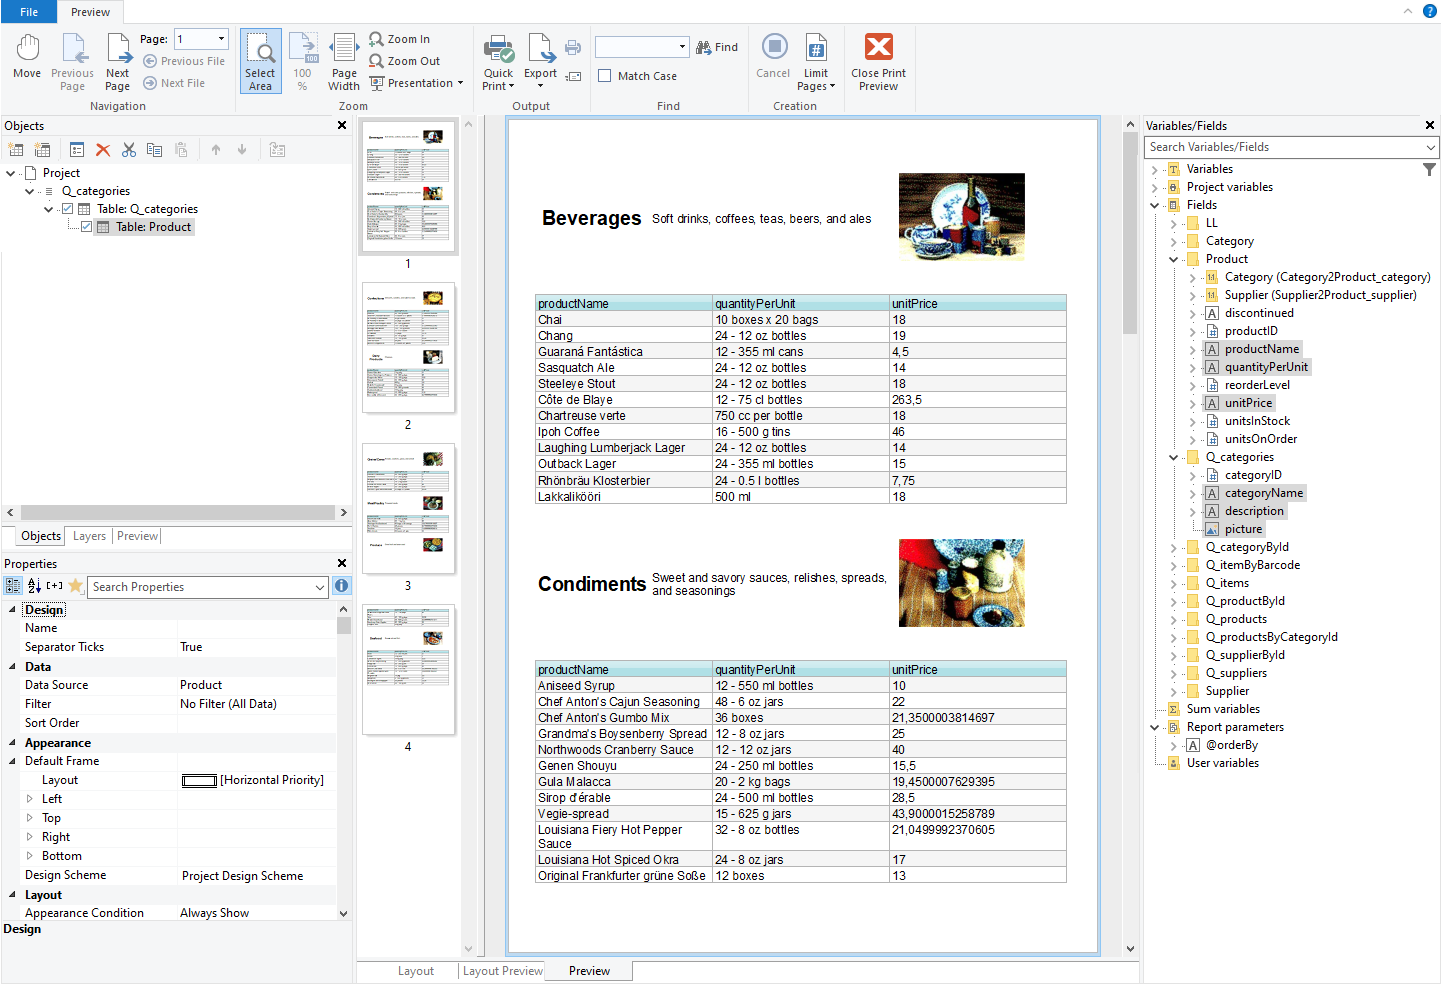
Adding JSON to the Available Export Formats
List & Label has supported a number of text based export formats for quite a while. You can have XML, CSV and layout TXT export in different variants. That way, you can use List & Label as a convenient way to convert your data from one of the supported data sources to something you can use in other applications again. But one very popular format was missing so far that's been around for quite a while: Java Script Object Notation aka JSON.

New GraphQL Data Source, Webhooks & more | Report Server 25 Improvements Part 2
As promised in our first blogpost about the innovations of Report Server 25, here comes the second part, including some very interesting features like Webhooks, connection string management or import/export of settings.
Supporting ZUGFeRD 2.0 in PDF Export
Version 1.0 of the electronic invoice data format ZUGFeRD for the exchange of invoices has already been supported. For List & Label 25, the specification of version 2.0, officially released in March 2019, is now also supported.
Full Support for .NET Core 3.0
.NET Standard and .NET Core have been around for a while now. We jumped the bandwagon early and offered beta support since LL23 while officially supporting the new framework since List & Label 24. With the advent of .NET Core 3.0, Microsoft announced that the .NET 4.x releases will be the last of their kind and .NET Core 3.0 – which will later simply be called .NET and will be named ".NET 5" in its next release – is the place to go. We're already there.
New SQL Routines in Data Sources and more | Report Server 25
The combit Report Server celebrates its 5th birthday. Right on time for the anniversary, the product again has some new features to offer. We focused especially on the wishes of our customers.
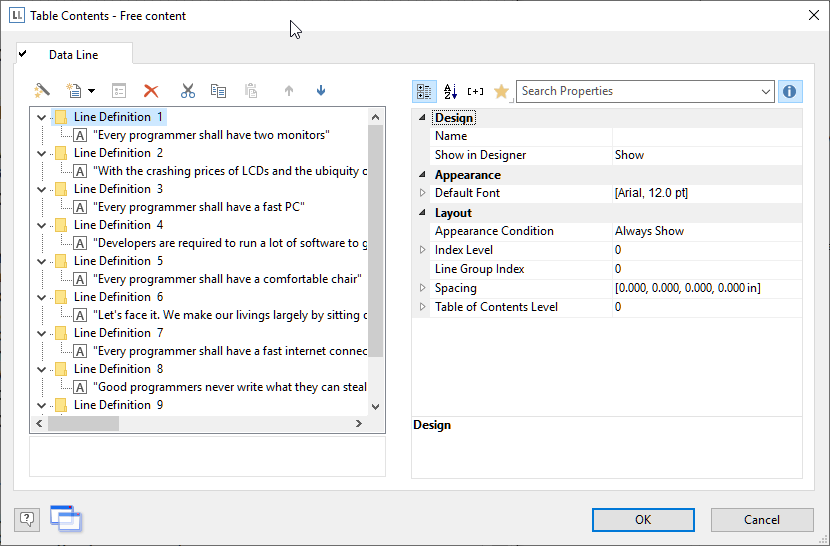
Keeping Groups of Table Lines Together
Continuing our quest to make the table object more versatile and powerful in LL25, we added an important tweak to the way table lines are kept together. Before, you just had the choice between keeping all lines together or none. That means, if the output for a single record stretched over a couple of pages and consisted of several line definitions, there was hardly ever a way to get the wrapping "right".
Adding Signature Support to the Email Module
This has been another great suggestion from our community at Idea Place. While the mail module is quite flexible and can send mails via SMTP, MAPI and XMAPI, and can either use the client's mail dialog or a custom, built in dialog, there was no way to append Outlook standard signatures to the sent mails so far. Microsoft has finally declined the request to add this feature to Outlook's MAPI implementation. So there was room for improvement.
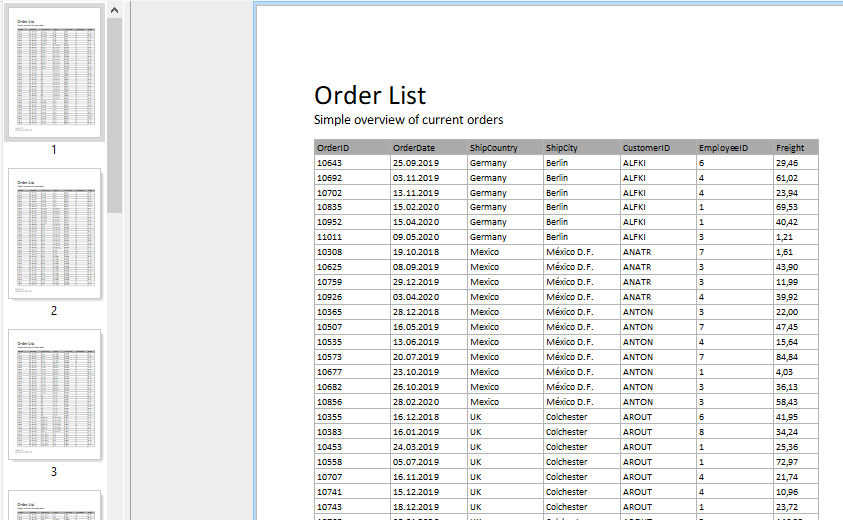
Infinite Pages for HTML and XLS Export
This is another of those "huh, you didn't have that before" features. As a WYSIWYG layout oriented reporting tool, the page has always been king for List & Label. While this is nice in many circumstances, when it comes to reporting for the web or XLS and printing is not planned at all, the result can be unwanted although looking beautiful.


