List & Label Reporting Blog
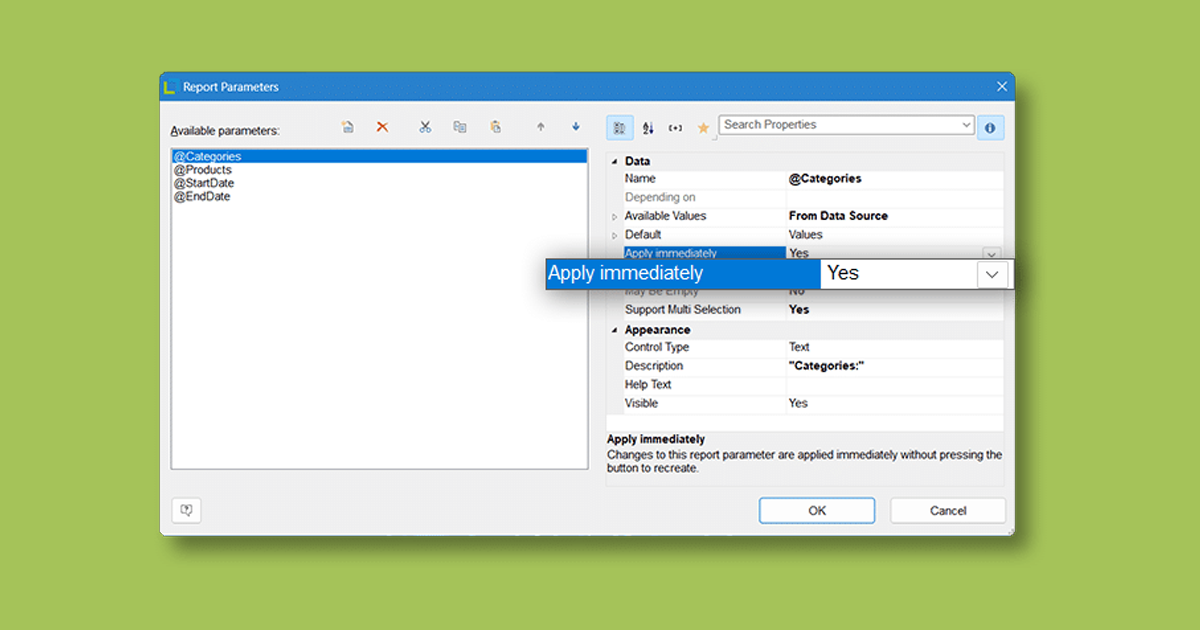
“Apply immediately” – new property for report parameters
With the new “Apply immediately” property for report parameters, you no longer have to click “Refresh” manually every time: as soon as you change a parameter with this option enabled, List & Label automatically re-renders your report. It saves you time, streamlines your workflow, and delivers an intuitive user experience—both on desktop and on the web.
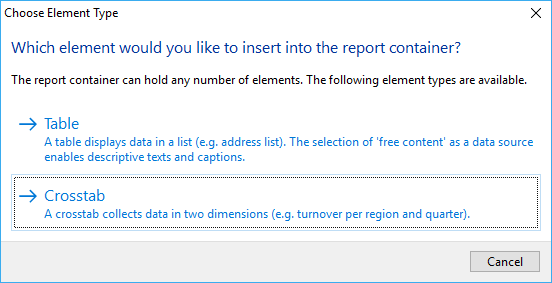
Creating Pivot/Crosstabs via Drag & Drop
A pivot/crosstab does a great job in aggregating your data and helps to spot trends and outliers. We’ve put great effort in enhancing our pivot/crosstab support for the last few versions. However, although there’s a nice wizard to get you started, usability testing showed that even creating simple pivot/crosstabs was still a challenging task for some users. That’s something we hope to change with LL24.
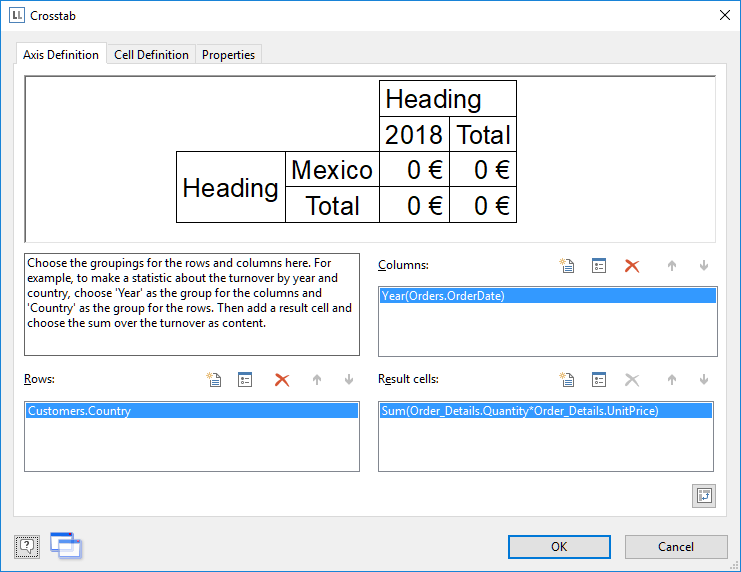
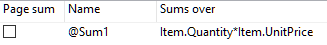
Converting Crosstabs to Charts and Vice Versa With List & Label
Crosstabs and charts have a lot in common. Often I find myself designing a crosstab for e.g. the sales per country. This works fine to get the absolute or even relative numbers. However, to get a visual impression of the fractions for a dashboard, I add a chart 99% of the time that shows just the same data as the crosstab.
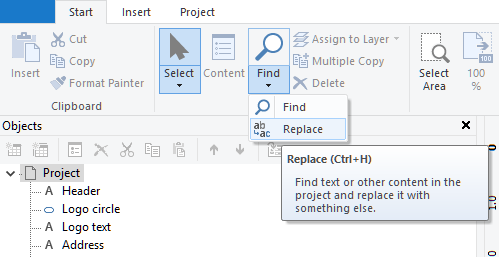
Easily Replacing Texts and Identifiers in the Designer
Continuing our quest for an improvement of the Designer’s refactoring features, it’s obvious that finding text alone is only halfway to quickly and easily refactoring your projects to accomodate them to changed field names, table names or other identifier changes. So we decided to take this project one step further and offer a powerful replace feature in LL24.
How to “Find” Things in the Designer
One of the most wanted features from our feature portal will finally be available in List & Label 24: a powerful find feature for the Designer.
Extending “Expandable Regions” to Groups
In Version 19, we introduced a new feature called "expandable regions". When activated on a top-level table, this will enable to dynamically collapse and expand the table's sub items in the preview and HTML5 viewer.
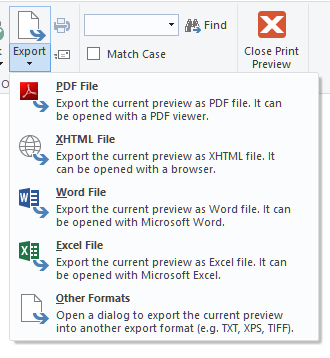
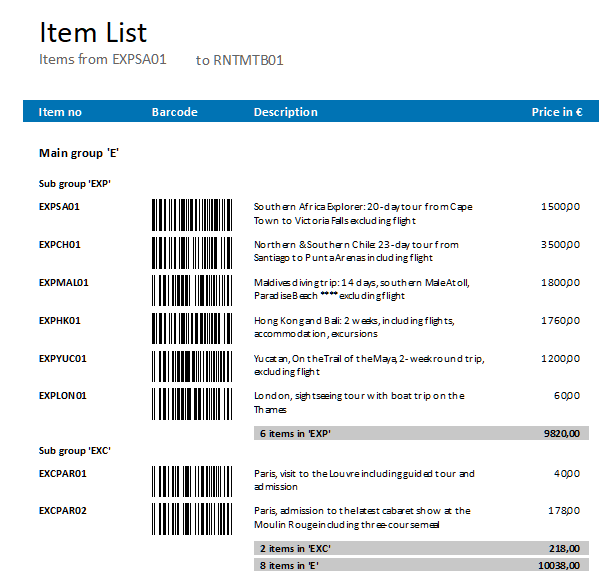
Export Files Directly From the Preview
So far, it hasn't been possible to export to all of our export formats from the preview window. The simple reason is that we're using the EMF file format internally while the exporters need completely different information that cannot be extracted from the EMF. Thus, we were only able to support image file formats and – of course – PDF, which is created from EMF vector information.

Innovations for Planned Reports and more | New in Report Server 24 – Part 2
This is the second blog post covering the new features of combit Report Server version 24.
I already introduced some new features in the Ad-hoc Designer.
How to Use List & Label .NET Directly in Java
With the help of Javonet, the List & Label .NET component can be easily integrated and used directly from Java – with the usual ease of use you are accustomed to from .NET. With this cooperation, Java customers have easy access e.g. to real data preview in the Designer, drilldown reporting and report parameters to name just a few of the interactive features.
Customer Wishes Implemented in the Ad-hoc Designer
Since version 3 of the Report Server, you can create reports quickly and easily with the Ad-hoc Designer. Since List & Label 23, this feature is also available for .NET developers for integration into their applications. Today I would like to show briefly which customer requests we were able to implement in combit List & Label 24 and Report Server 24 in the Ad-hoc Designer.
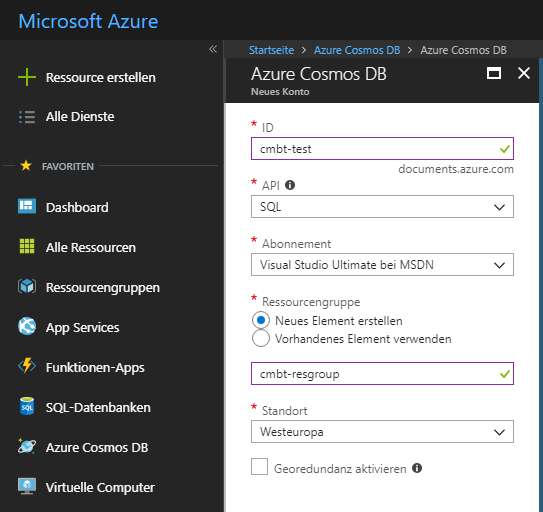
Connect to Microsoft’s Cosmos DB with Reporting Tool List & Label
Microsoft’s Cosmos DB is a cloud based, scalable database service that has become quite popular since its initial launch in May 2017. I thought it might be a nice idea to check it out and – while I’m at it – see how I can connect my favorite reporting tool to it.


